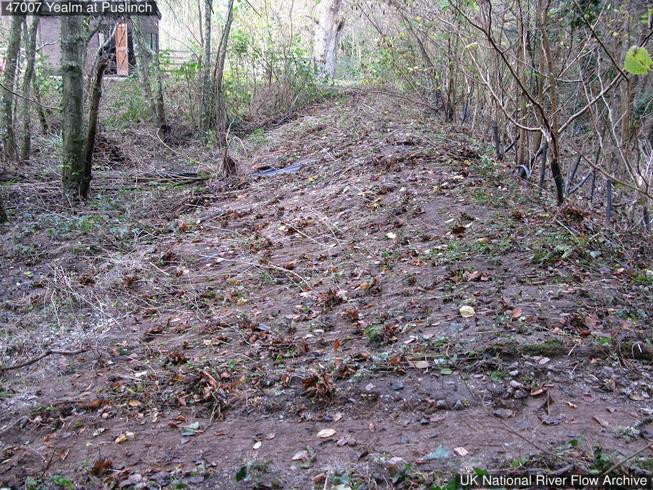
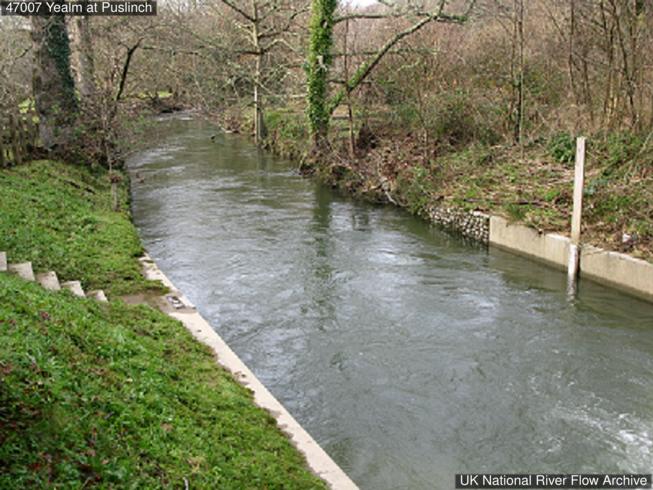
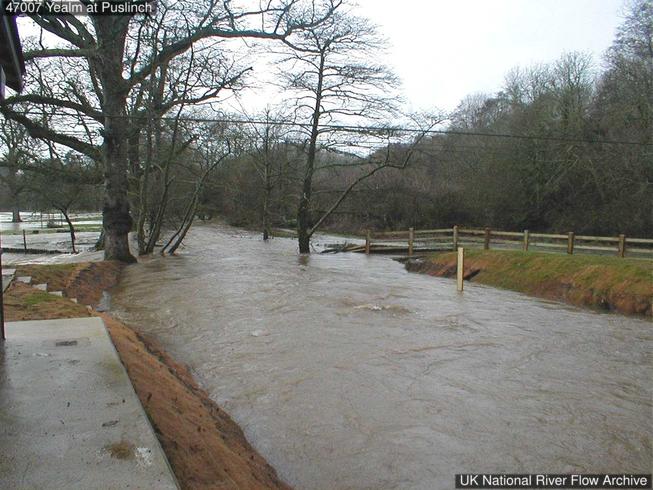
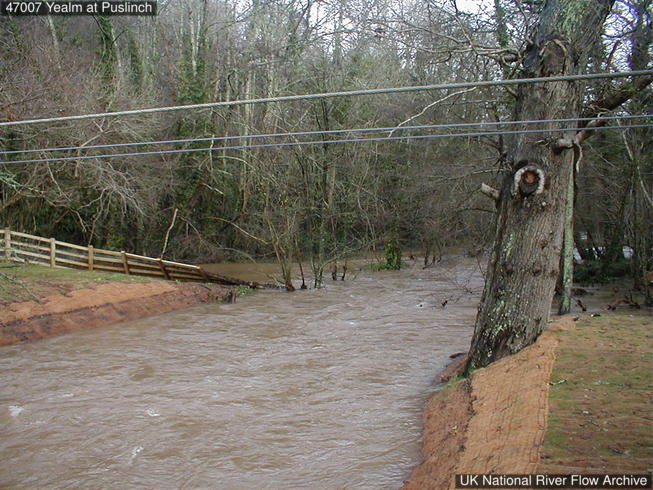
Geographic coordinates may reflect the access point for the gauge, and not the precise location in the watercourse that it is taking readings from.
Catchment Character
🌊 Mixed responseA balance of quick runoff and slower groundwater baseflow.
Your catchment is all the land that drains rainfall into the river above this gauge. Its character — how
steep, wet, wooded, urban or chalky that land is — decides how fast rain here turns into a rising river. A steep, bare or clay
catchment is “flashy” (rises and falls quickly, floods easily); a flat, chalk or well-wooded one is
slow and steady. The tiles below put numbers to that; the flow-duration curve reads left-to-right
from the river’s typical high flows (Q5) down to its low flows (Q95) — a steep curve means a flashy river.
The physical character of the land that drains to this gauge, and how it shapes its flood response — from the National River Flow Archive (UKCEH).
Baseflow Index
0.55
mixed response
Avg Annual Rainfall
1,537 mm/yr
1991–2020 · +4% since 1941–70
Urban Extent
1.7%
largely rural
Median Annual Flood
40.42 m³/s
QMED — typical yearly peak flow
Highest Daily Mean Flow
31.00 m³/s
10 Mar 1981 · daily mean, not the instantaneous peak
Flow-Duration Curve
Daily flow (m³/s) exceeded each % of the time — a steep curve is flashy, a flat one is steady. Q5 high · Q50 median · Q95 low.
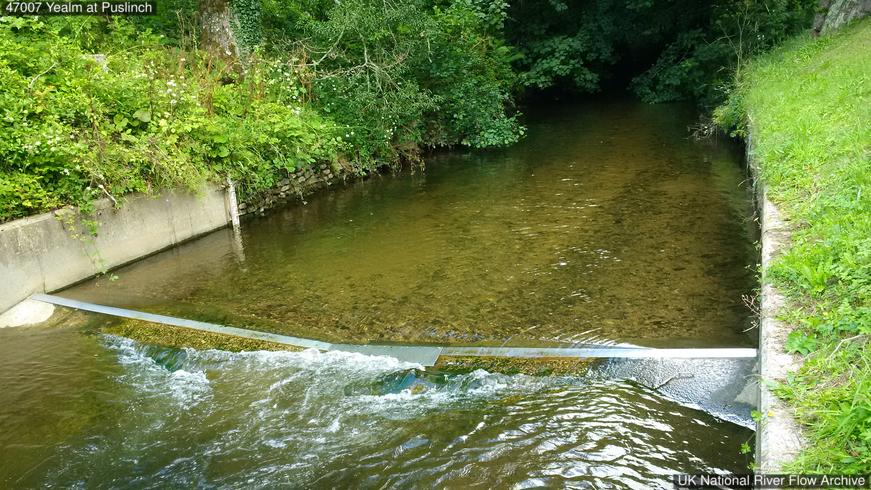
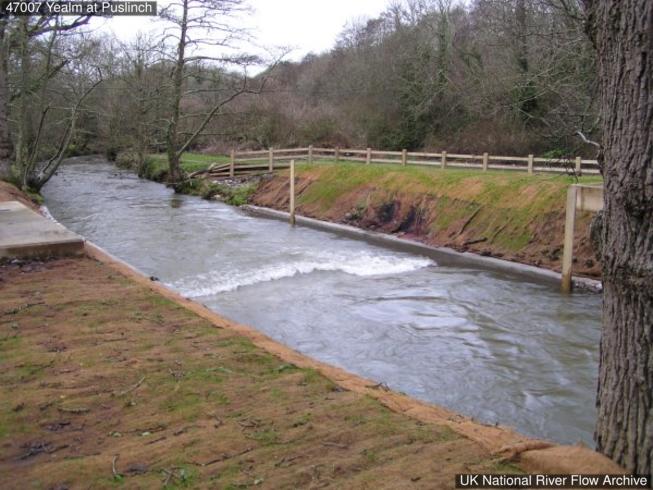
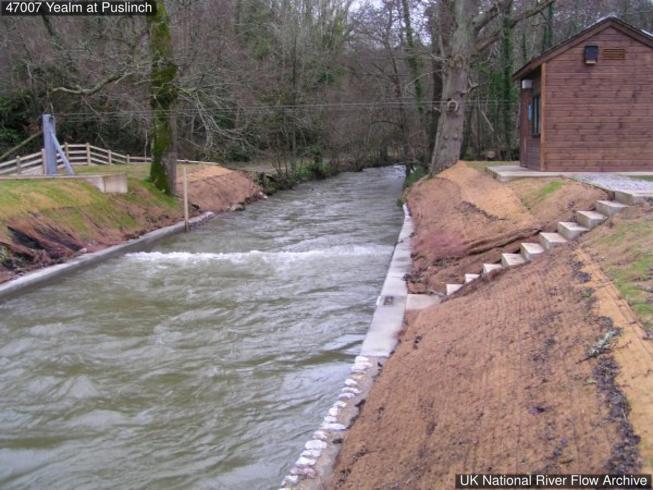
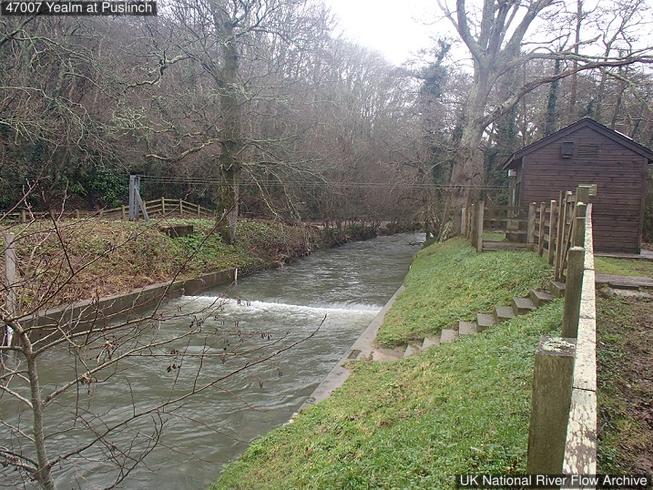
Flat V weir installed 2002, with crest tapping and downstream level measurement to calculate drowned flows.
More detail
The catchment
South Dartmoor catchment with rapid response. Headwaters drain Dartmoor Granite and metamorphosed Devonian slates. Most of catchment underlain by Devonian shales and tuffs with subordinate limestone. Land use is meadowland, arable and low grade agriculture. No major catchment changes.
The station
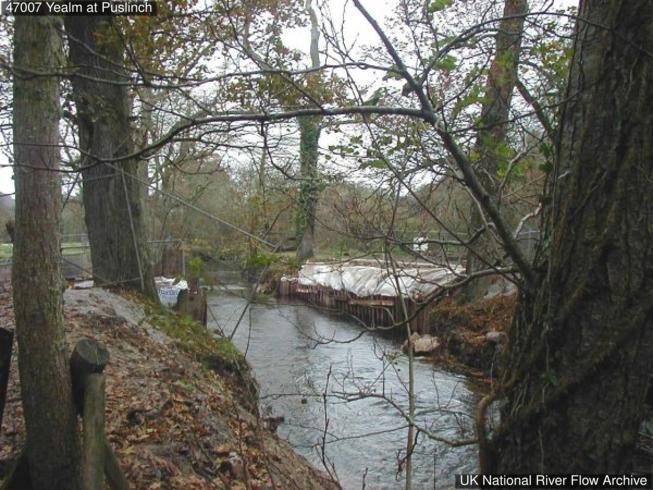
Flat V weir installed 2002, with crest tapping and downstream level measurement to calculate drowned flows. Modular at 0.82m. Prior to 2001 station consisted of a low flow rectangular flume, 4.7m throat width, side and bottom contractions, this, in turn, superseded a velocity-area station in 07/1967.
How it measures flow
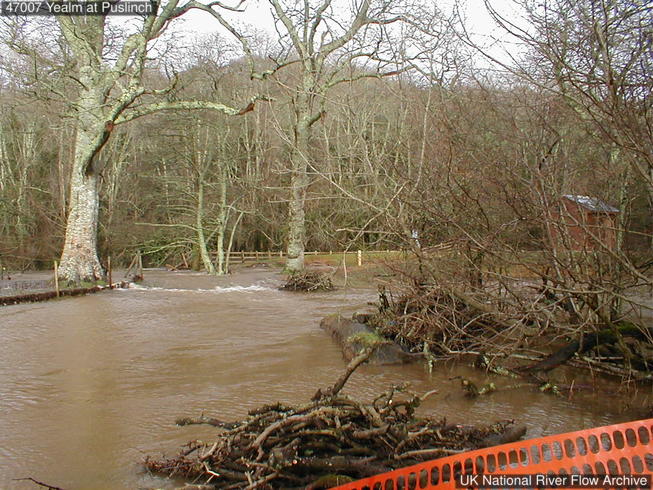
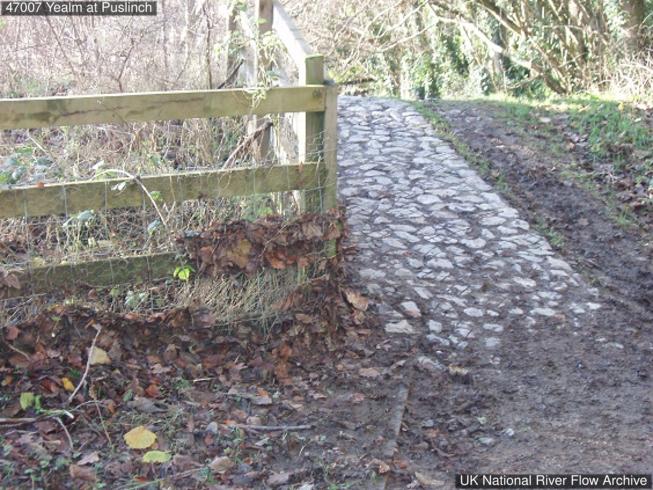
Bankfull approx. mean annual flood level; downstream bridge truncates peaks. Prior to 2000 station was bypassed. Entrainment banks rebuilt in 2001 at higher level than previous, as have overtopped in the past. Previous banks overtopped more frequently but overtopped during 2012 flood events. POR maximum flow of 46.2 cumecs in 12/2000 is an estimate provided by the EA, which is thought to be reasonable. Good rating, well-gauged across the flow range. Lower end re-rated in 2011 and earlier flows recalculated. No liability to backwater or tidal influence. New rating prepared in 2013 for weir period using observations of overtopping of flood banks (> 2.125m) during July, Nov, Dec and 2012 floods. Peak flow ratings cover: the period pre-1967 before the flume was operational, the period when flume was operational (1967-2001) and the period since 2002 when the flat V was built. Acoustic Doppler installed in 08/2014 to improve high flows.
Flow regime
Moderate influence from public water supply and industrial/agricultural abstractions and imports.
The flow record
Closed from 09/2001 to 11/2002 for installation of new weir. Full period of record peak flow data reviewed and released in October 2018 (WINFAP Files v7).
How this gauging station is built and how long it has measured (NRFA / UKCEH).
Gauge type
Flat-V weir
Operating since
1963
Station datum
5.5 mAOD
Flow record
1963–2024 · 61 yrs · 98% complete
Peak-flow record
since 1962
Hydrometric area
47
Measured by
Environment Agency
Nearby Groundwater
Soil Moisture
💧 Storm overflows on this river
Frequently asked questions
Is PUSLINCH flooding today?
The latest recorded level is 0.36m. Compare it with the recent history on the chart above to judge whether levels are unusually high.
Is the river level rising or falling at PUSLINCH?
Based on the most recent readings, the level is currently steady. The chart above shows the last 12 hours of measurements by default (up to 7 days), updated roughly every 15 minutes.
How often is this river level data updated?
Readings are supplied by the Environment Agency gauge. FloodRadar checks for updates roughly every 15 minutes; the timestamp above shows how recent the latest available reading is.
Embed this gauge on your website
Free live river-level widget — ideal for parish councils, angling clubs and local sites. Updates automatically.
Preview
📮 Flood risk by postcode near this gauge
Postcodes within 5 km with properties in the Environment Agency’s rivers-and-sea flood-risk bands:
 FloodRadar
Log inCreate free account
FloodRadar
Log inCreate free account