
Updated 19 September 2026 · data through 18 September 2026 · next NOAA update 8 October 2026
El Niño live tracker
NOAA’s status: El Niño Advisory (issued 10 September 2026)
“El Niño is strengthening, with a greater than 90% chance of a very strong event during the Northern Hemisphere fall and winter 2026-27.”
NOAA Climate Prediction Center, El Niño discussion of 10 September 2026
- Niño 3.4, latest week
- 2.9 °C
- against 1991–2020, week of 6–12 September 2026
- On NOAA’s relative scale
- 2.0
- the same week
- NOAA’s official three-month index
- 1.4
- RONI, June–August 2026 provisional
Sea temperatures in the Niño 3.4 region of the east-central Pacific were 2.9 °C warmer than normal in the week of 6–12 September 2026, up 0.3 °C in four weeks; on NOAA’s official relative scale, which subtracts the warming of the wider tropics, the same week reads 2.0. (NOAA Climate Prediction Center, weekly OISST v2.1, against 1991–2020.) why two numbers?
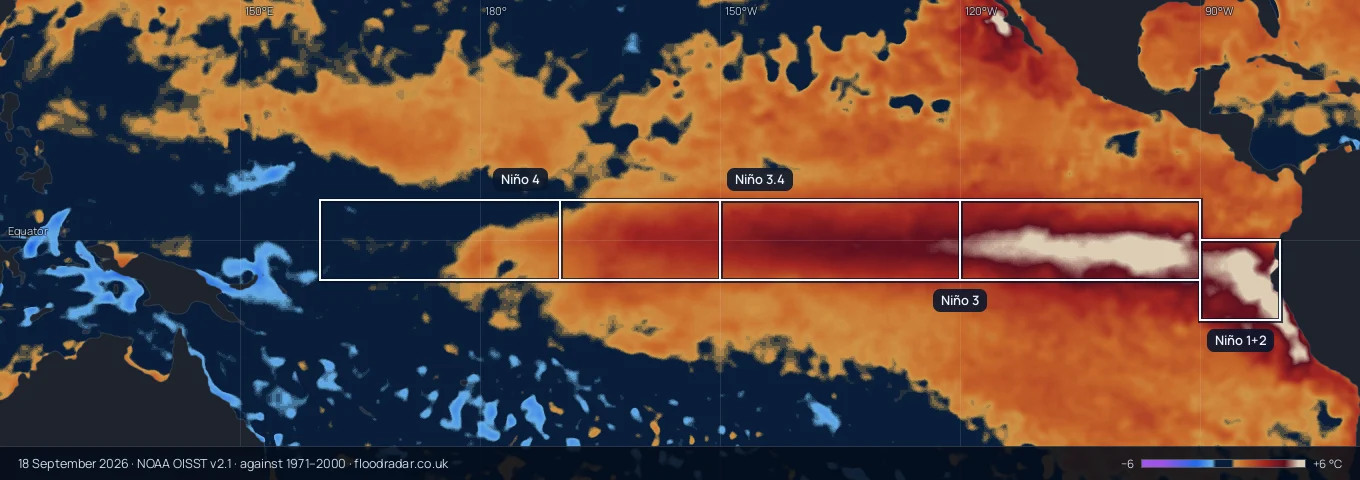
Figures in the boxes: weekly values, week of 6–12 September 2026, on the field of 18 September 2026.
Skip the globe controlsSea surface against its 1971–2000 average, °C
Colour scale from 6 °C or more cooler, violet, through no colour within half a degree of normal, to 6 °C or more warmer, cream.
18 September 2026 · NOAA OISST v2.1 · against 1971–2000
| Region | Traditional, °C | Relative scale |
|---|---|---|
| Niño 1+2 | +4.5 | +3.7 |
| Niño 3 | +3.7 | +2.8 |
| Niño 3.4 | +2.9 | +2.0 |
| Niño 4 | +0.9 | −0.1 |
For specialists: the equator, one day a week
This chart could not be drawn in this browser. The weekly values for each region are in the tables on this page.
NOAA OISST v2.1, mean of 5°S–5°N per degree of longitude (FloodRadar calculation).
How close to the weekly record?
Same week in 1982, 1.0 °C; in 1997, 1.8 °C; in 2015, 1.7 °C.
- How big: Niño 3.4 in the east-central Pacific was 2.9 °C warmer than normal in the week of 6–12 September 2026; it reads 2.0 on NOAA’s official relative scale. (NOAA Climate Prediction Center, weekly OISST v2.1, against 1991–2020.)
- Is it a record?: Below the record on NOAA’s official three-month measure: 1.4 (provisional) for June–August 2026, against 2.4 in December 1982–February 1983 (FloodRadar’s reading of NOAA CPC’s RONI.ascii.txt, since 1950).
- When it peaks and fades: NOAA’s median forecast of 10 September 2026 peaks in October–December 2026; the chance of El Niño falls below 50% in April–June 2027.
- Britain: In the seven El Niño winters since 2006–07, England had between 1,479 and 8,291 flood alerts and warnings (average 4,116; the four neutral winters averaged 4,173). (FloodRadar’s archive of Environment Agency flood alerts, warnings and severe warnings in England, October to March.)
Is it the strongest on record?
- On NOAA’s official three-month measure, the relative index (RONI) reads 1.4 for June–August 2026, 1.0 below its record of 2.4 (December 1982–February 1983); the traditional ONI is 1.8 °C above normal, 0.8 °C below its record of 2.6 °C (November 2015–January 2016), provisionally the highest June–August since 1950. Both are provisional: NOAA may revise them for up to two months. (FloodRadar’s reading of NOAA CPC’s RONI.ascii.txt and oni.ascii.txt, both since 1950.)
- In the week of 6–12 September 2026 Niño 3.4 was 2.9 °C above normal, 0.1 °C below the weekly record of 3.0 °C (week of 15–21 November 2015); on the relative scale it reads 2.0, 0.9 below the record of 2.9 (week of 26 December 1982–1 January 1983). (FloodRadar’s reading of NOAA CPC’s wksst9120.for and rel_wksst9120.txt, both since 1981.)
- During this event Niño 1+2 and Niño 3 have already had their highest weeks since September 1981 on the traditional scale, but not on the relative scale. (FloodRadar’s reading of NOAA CPC’s wksst9120.for and rel_wksst9120.txt, both since 1981.)
- Three-quarters of NOAA’s forecast range for October–December 2026 lies at or above 2.44; the record is 2.40 (December 1982–February 1983). (FloodRadar’s reading of NOAA CPC’s RONI.ascii.txt, since 1950.)
Each Niño region’s latest week, the week of 6–12 September 2026, against its highest week, on both scales. Traditional: FloodRadar’s reading of NOAA CPC’s wksst9120.for, since 1981. Relative: FloodRadar’s reading of NOAA CPC’s rel_wksst9120.txt, since 1981. Swipe the table sideways for the relative scale.
| Traditional, °C against normal | NOAA’s relative scale | |||||
|---|---|---|---|---|---|---|
| Now | Record, and when | State | Now | Record, and when | State | |
| Niño 1+2 | 4.5 °C | 4.6 °Cweek of 30 August–5 September 2026 | 0.1 °C below the record | 3.7 | 4.6week of 26 June–2 July 1983 | 0.9 below the record |
| Down from this event’s high of 4.6 °C (week of 30 August–5 September 2026), which is the record | Down from this event’s high of 3.9 (week of 30 August–5 September 2026) | |||||
| Niño 3 | 3.7 °C | 3.7 °Cweek of 6–12 September 2026 | New record | 2.8 | 3.6week of 26 December 1982–1 January 1983 | 0.8 below the record |
| Niño 3.4 | 2.9 °C | 3.0 °Cweek of 15–21 November 2015 | 0.1 °C below the record | 2.0 | 2.9week of 26 December 1982–1 January 1983 | 0.9 below the record |
| Niño 4 | 0.9 °C | 1.7 °Cweek of 15–21 November 2015 | 0.8 °C below the record | −0.1 | 1.5week of 1–7 March 1992 | Below the record |
| Down from this event’s high of 1.3 °C (week of 7–13 June 2026) | Down from this event’s high of 0.8 (week of 7–13 June 2026) | |||||
Niño 3.4 over a month, three months and a day, against the highest on each file. The three-month row puts NOAA’s traditional ONI beside its official relative RONI. Swipe the table sideways for the relative scale.
| Traditional, °C against normal | NOAA’s relative scale | |||||
|---|---|---|---|---|---|---|
| Now | Record, and when | State | Now | Record, and when | State | |
| Niño 3.4, monthlyAugust 2026 | 2.52 °C | 2.72 °CNovember 2015 | 0.20 °C below the record | 1.78 | 2.51December 1982 | 0.73 below the record |
| Three-month index (ONI and RONI)June–August 2026 | 1.80 °C provisional | 2.59 °CNovember 2015–January 2016 | 0.8 °C below the record | 1.36 provisional | 2.40December 1982–February 1983 | 1.0 below the record |
| Niño 3.4, daily18 September 2026 | 2.9 °C preliminary | 3.0 °C19 November 2015 | 0.1 °C below the record | Not published on the relative index | ||
| Down from this event’s high of 3.0 °C (15 September 2026) | ||||||
NOAA’s table rounds these to one decimal (ONI 1.80 as 1.8 and RONI 1.36 as 1.4); the file carries two. The latest seasons are provisional: NOAA may revise them for up to two months.
Records raised during this event (8)
- Niño 1+2 weekly, against normal 4.6 °C week of 30 August–5 September 2026 Raised once, in the week of 30 August–5 September 2026 Before this event: 4.5 °C, week of 26 June–2 July 1983 (FloodRadar’s reading of NOAA CPC’s wksst9120.for, since 1981; against 1991–2020)
- Niño 3 weekly, against normal 3.7 °C week of 6–12 September 2026 Raised three times since the week of 23–29 August 2026 Before this event: 3.3 °C, week of 9–15 November 1997 (FloodRadar’s reading of NOAA CPC’s wksst9120.for, since 1981; against 1991–2020)
- Niño 1+2 monthly, against normal 4.08 °C August 2026 Raised once, in August 2026 Before this event: 4.03 °C, June 1983 (FloodRadar’s reading of NOAA CPC’s sstoi.indices, since 1982; against 1991–2020)
- Niño 3 monthly, against normal 3.13 °C August 2026 Raised once, in August 2026 Before this event: 3.07 °C, December 1997 (FloodRadar’s reading of NOAA CPC’s sstoi.indices, since 1982; against 1991–2020)
- Upper-ocean heat, 130°E–80°W 2.19 °C August 2026 Raised three times since April 2026 Before this event: 1.55 °C, June 1997 (FloodRadar’s reading of NOAA CPC’s heat_content_index.txt, since 1979; against 1981–2010)
- Upper-ocean heat, 160°E–80°W 2.77 °C August 2026 Raised four times since April 2026 Before this event: 2.05 °C, October 1997 (FloodRadar’s reading of NOAA CPC’s heat_content_index.txt, since 1979; against 1981–2010)
- Upper-ocean heat, 180°–100°W 3.23 °C August 2026 Raised twice since July 2026 Before this event: 2.56 °C, October 1997 (FloodRadar’s reading of NOAA CPC’s heat_content_index.txt, since 1979; against 1981–2010)
- Warm water volume, against normal 3.24 × 10¹⁴ m³ July 2026 Raised once, in July 2026 Before this event: 3.12 × 10¹⁴ m³, April 1997 (FloodRadar’s reading of NOAA PMEL’s wwv.dat, since 1980; data: GTMBA Project Office, NOAA/PMEL; against 1981–2010)
This chart could not be drawn in this browser. The table below carries the latest weeks; the sentence above compares them with 1982, 1997 and 2015.
| Traditional, °C against 1991–2020 | NOAA’s relative scale | |||||||
|---|---|---|---|---|---|---|---|---|
| Niño 1+2 | Niño 3 | Niño 3.4 | Niño 4 | Niño 1+2 | Niño 3 | Niño 3.4 | Niño 4 | |
| Week of 6–12 September 2026 | +4.5 | +3.7 | +2.9 | +0.9 | +3.7 | +2.8 | +2.0 | −0.1 |
| Week of 30 August–5 September 2026 | +4.6 | +3.5 | +2.7 | +1.0 | +3.9 | +2.7 | +1.8 | +0.1 |
| Week of 23–29 August 2026 | +4.2 | +3.4 | +2.6 | +1.0 | +3.5 | +2.6 | +1.8 | +0.1 |
| Week of 16–22 August 2026 | +4.0 | +3.2 | +2.6 | +0.8 | +3.2 | +2.5 | +1.8 | 0.0 |
| Week of 9–15 August 2026 | +4.1 | +3.2 | +2.6 | +1.0 | +3.4 | +2.5 | +1.8 | +0.1 |
| Week of 2–8 August 2026 | +4.0 | +3.0 | +2.5 | +1.0 | +3.2 | +2.3 | +1.7 | +0.2 |
| Week of 26 July–1 August 2026 | +3.8 | +2.8 | +2.4 | +1.0 | +3.2 | +2.1 | +1.6 | +0.2 |
| Week of 19–25 July 2026 | +3.6 | +2.5 | +2.2 | +1.0 | +3.0 | +1.8 | +1.4 | +0.3 |
| Week of 12–18 July 2026 | +3.7 | +2.3 | +2.1 | +1.1 | +2.8 | +1.6 | +1.4 | +0.4 |
| Week of 5–11 July 2026 | +3.3 | +2.2 | +2.0 | +1.2 | +2.6 | +1.6 | +1.3 | +0.5 |
| Week of 28 June–4 July 2026 | +3.3 | +2.0 | +1.7 | +1.1 | +2.7 | +1.5 | +1.2 | +0.5 |
| Week of 21–27 June 2026 | +3.1 | +2.0 | +1.8 | +1.2 | +2.5 | +1.5 | +1.2 | +0.6 |
NOAA Climate Prediction Center: weekly OISST v2.1 files wksst9120.for and rel_wksst9120.txt, against 1991–2020.
When will it peak, and when will it end?
Forecast NOAA, issued 10 September 2026
- Peak of NOAA’s median forecast
- 2.67
- October–December 2026, on the relative three-month index; nine-in-ten range 2.12 to 3.23
- Chance El Niño is still in place
- 97%
- February–April 2027
- When the chance first falls below half
- 43%
- April–June 2027
NOAA’s outlook of 10 September 2026 puts the peak of its median forecast in October–December 2026, at 2.67 on its relative three-month index (nine-in-ten range 2.12 to 3.23). The record on that index is 2.40, for December 1982–February 1983 (FloodRadar’s reading of NOAA CPC’s RONI.ascii.txt, since 1950); the latest observed value is 1.4, for June–August 2026 (provisional). NOAA puts the chance that El Niño is still in place in February–April 2027 at 97%, and in April–June 2027 at 43%.
NOAA’s strength odds of 10 September 2026 put the chance that its relative three-month index sits at 2.0 or above at 98% in October–December 2026, its largest of the nine seasons in the table, and at 0% by April–June 2027. (NOAA Climate Prediction Center.)
This chart could not be drawn in this browser. The table below carries every figure.
| El Niño, all strengths | El Niño side, by strength | Neutral−0.5 to 0.5 | La Niña side, by strength | |||||||
|---|---|---|---|---|---|---|---|---|---|---|
| 2.0 or above | 1.5 to 2.0 | 1.0 to 1.5 | 0.5 to 1.0 | −1.0 to −0.5 | −1.5 to −1.0 | −2.0 to −1.5 | −2.0 or below | |||
| August–October 2026 | 100 | 77 | 23 | 0 | 0 | 0 | 0 | 0 | 0 | 0 |
| September–November 2026 | 100 | 97 | 3 | 0 | 0 | 0 | 0 | 0 | 0 | 0 |
| October–December 2026 | 100 | 98 | 2 | 0 | 0 | 0 | 0 | 0 | 0 | 0 |
| November 2026–January 2027 | 100 | 93 | 7 | 0 | 0 | 0 | 0 | 0 | 0 | 0 |
| December 2026–February 2027 | 100 | 75 | 21 | 4 | 0 | 0 | 0 | 0 | 0 | 0 |
| January–March 2027 | 100 | 39 | 39 | 19 | 3 | 0 | 0 | 0 | 0 | 0 |
| February–April 2027 | 97 | 5 | 27 | 45 | 20 | 3 | 0 | 0 | 0 | 0 |
| March–May 2027 | 82 | 0 | 4 | 30 | 48 | 18 | 0 | 0 | 0 | 0 |
| April–June 2027 | 43 | 0 | 0 | 8 | 35 | 55 | 2 | 0 | 0 | 0 |
NOAA Climate Prediction Center: RONI strength probabilities, issued 10 September 2026. NOAA rounds to whole per cents.
This chart could not be drawn in this browser. The tables below carry every figure.
| Season | RONI |
|---|---|
| January–March 2026 | −0.76 |
| February–April 2026 | −0.44 |
| March–May 2026 | −0.04 |
| April–June 2026 | +0.49 |
| May–July 2026 | +0.97 provisional |
| June–August 2026 | +1.36 provisional |
| Season | 5th | 15th | 25th | Middle (50th) | 75th | 85th | 95th |
|---|---|---|---|---|---|---|---|
| August–October 2026 | 1.80 | 1.90 | 1.96 | 2.07 | 2.18 | 2.24 | 2.34 |
| September–November 2026 | 2.01 | 2.16 | 2.26 | 2.43 | 2.60 | 2.69 | 2.85 |
| October–December 2026 | 2.12 | 2.32 | 2.44 | 2.67 | 2.90 | 3.02 | 3.23 |
| November 2026–January 2027 | 1.87 | 2.13 | 2.28 | 2.57 | 2.85 | 3.00 | 3.26 |
| December 2026–February 2027 | 1.48 | 1.77 | 1.94 | 2.27 | 2.59 | 2.76 | 3.06 |
| January–March 2027 | 1.04 | 1.33 | 1.50 | 1.82 | 2.14 | 2.31 | 2.59 |
| February–April 2027 | 0.56 | 0.82 | 0.97 | 1.26 | 1.54 | 1.69 | 1.95 |
| March–May 2027 | 0.17 | 0.40 | 0.54 | 0.79 | 1.05 | 1.19 | 1.42 |
| April–June 2027 | −0.27 | −0.03 | 0.12 | 0.38 | 0.65 | 0.80 | 1.04 |
NOAA Climate Prediction Center: RONI.ascii.txt and the RONI forecast ranges issued 10 September 2026. Values as NOAA publishes them, shown to two decimals. The record line is FloodRadar’s reading of NOAA CPC’s RONI.ascii.txt, since 1950.
This chart could not be drawn in this browser. The table below carries every figure.
| Season | All models | Physics-based | Statistics-based | Lowest | Highest | Models |
|---|---|---|---|---|---|---|
| August–October 2026 | 2.7 | 3.0 | 2.4 | 1.5 | 3.7 | 26 |
| September–November 2026 | 3.0 | 3.3 | 2.6 | 1.5 | 4.1 | 26 |
| October–December 2026 | 3.2 | 3.4 | 2.8 | 1.7 | 4.5 | 26 |
| November 2026–January 2027 | 3.2 | 3.4 | 2.9 | 1.9 | 4.9 | 26 |
| December 2026–February 2027 | 2.8 | 3.0 | 2.8 | 1.6 | 4.2 | 22 |
| January–March 2027 | 2.4 | 2.5 | 2.4 | 1.2 | 3.8 | 20 |
| February–April 2027 | 1.9 | 2.0 | 1.9 | 0.7 | 3.1 | 19 |
| March–May 2027 | 1.3 | 1.5 | 1.3 | 0.3 | 2.3 | 18 |
| April–June 2027 | 0.9 | 1.1 | 0.8 | −0.2 | 1.8 | 18 |
CC BY 4.0. ENSO Forecast Data © 2002-2026 by International Research Institute for Climate and Society is licensed under Creative Commons Attribution 4.0 International. Values read from the published figure; redrawn by FloodRadar.
NOAA’s range is on its relative index and IRI’s models are on the traditional index, so the two forecasts cannot be read against each other.
The highest three-month value of NOAA’s relative index since 1950 is 2.40, for December 1982–February 1983 (FloodRadar’s reading of NOAA CPC’s RONI.ascii.txt, since 1950). Every value above that line is outside experience.
The highest three-month average of NOAA’s monthly Niño 3.4 file since 1982 is 2.53, for November 2015–January 2016 (FloodRadar’s reading of NOAA CPC’s sstoi.indices, three-month means, since 1982). Every value above that line is outside experience.
NOAA says the strength of an event “does not necessarily correspond with the strength of the influence or expected impact” (NOAA Climate Prediction Center).
What does it mean for Britain?
Past El Niño winters in FloodRadar’s archive
In FloodRadar’s archive of Environment Agency flood alerts and warnings raised in England each October to March since 2006–07, the seven El Niño winters (classed by NOAA’s traditional ONI) ranged from 1,479 (2018–19) to 8,291 (2023–24), an average of 4,116; the four neutral winters averaged 4,173 and the nine La Niña winters averaged 2,739. That is context, not a forecast. Classed by NOAA’s official relative index instead, 2019–20 is not an El Niño winter, and the El Niño average is 3,569 against 5,966 for the three neutral winters.
- El Niño winters (7) 1,479 (2018–19) to 8,291 (2023–24), average 4,116
- Neutral winters (4) 1,714 (2016–17) to 5,886 (2013–14), average 4,173
- La Niña winters (9) 723 (2011–12) to 5,316 (2025–26), average 2,739
FloodRadar’s archive of Environment Agency flood alerts, warnings and severe warnings in England, October to March; winters classed by NOAA’s November–January ONI from oni.ascii.txt (0.5 or more El Niño, −0.5 or less La Niña). The bar runs from the quietest to the busiest winter of each kind; the mark is the average.
Britain right now
These show what is happening in Britain now. They are not a measure of El Niño’s effect. No single wet week can be pinned on it.
0
and in force in England right now
No area was under a warning at the last sync. See them on the map.
105%
of the normal rainfall for these weeks
The of 895 with a full 30 days of readings caught 105% of its own 1991-2020 average for 21 August to 19 September.
19%
of river gauges are running above their own average for these weeks
196 gauges qualified, each compared only with its own past. Tide gauges, gauges on sluices and weirs, and gauges with a flagged sensor are left out.
The Met Office is explicit that El Niño “does not determine exactly what conditions we will experience”.
Why do I see 2.9, 2.9, 2.0 and 1.4 for the same ocean?
| How much warmer the water is (traditional) | How much El Niño stands out (NOAA’s official relative scale) | |
|---|---|---|
| Latest day18 September 2026 | 2.9°Cpreliminary | Not published on the relative index |
| FloodRadar calculation: Climate Reanalyzer’s NOAA OISST v2.1 daily Niño 3.4 temperature minus its 1991–2020 daily mean, shown to one decimal; the latest days are preliminary and NOAA replaces them after about two weeks. | ||
| Latest weekweek of 6–12 September 2026 | 2.9°C | 2.0 |
| Latest monthAugust 2026 | 2.52°C | 1.78 |
| Latest three monthsJune–August 2026 | ONI1.8°Cprovisional | RONI1.4provisional |
| NOAA’s table rounds these to one decimal (ONI 1.80 as 1.8 and RONI 1.36 as 1.4); the file carries two. The latest seasons are provisional: NOAA may revise them for up to two months. | ||
NOAA’s relative scale reads 0.9 lower than the traditional index in the week of 6–12 September 2026 (weekly Niño 3.4).
An anomaly, not a temperature
None of these is a temperature. Every figure in the left-hand column is an : how far the sea surface in is from normal for that place and time of year, not the temperature of the water itself. The relative figures on the right start from that same anomaly and take the tropics out of it, which the “Why NOAA subtracts the tropics” card explains.
Speedometer and average speed
A day or a week is the speedometer; the three-month index is your average speed. It smooths the latest weeks away, so it trails the ocean.
Why NOAA subtracts the tropics
All tropical oceans have warmed, so NOAA’s relative scale takes that background out to show how much El Niño itself stands out. Use the traditional figure for how warm the water is, the relative one to compare with 1997 or 2015.
Is climate change involved?
This chart could not be drawn in this browser. The table below carries the decade averages.
| Decade | ONI minus RONI | Seasons |
|---|---|---|
| 1990s | −0.11 | 120 |
| 2000s | +0.01 | 120 |
| 2010s | +0.22 | 120 |
| 2020s so far | +0.44 | 79 |
FloodRadar calculation from NOAA Climate Prediction Center’s oni.ascii.txt and RONI.ascii.txt, same seasons only.
Is there more heat to come?
This chart could not be drawn in this browser. The tables below carry the same months.
| Month | °C | |
|---|---|---|
| August 1982 | +1.61 | |
| August 1997 | +1.79 | |
| August 2015 | +1.97 | |
| August 2026 | +3.23 |
| Month | 130°E–80°W | 160°E–80°W | 180°–100°W |
|---|---|---|---|
| August 2026 | +2.19 | +2.77 | +3.23 |
| July 2026 | +2.03 | +2.50 | +2.96 |
| June 2026 | +1.79 | +2.14 | +2.26 |
| May 2026 | +1.67 | +1.97 | +1.99 |
| April 2026 | +1.85 | +2.07 | +2.24 |
| March 2026 | +1.38 | +1.39 | +1.36 |
| February 2026 | +1.08 | +1.02 | +1.15 |
| January 2026 | +0.64 | +0.45 | +0.49 |
| December 2025 | +0.26 | +0.01 | −0.03 |
| November 2025 | −0.02 | −0.33 | −0.46 |
| October 2025 | −0.01 | −0.29 | −0.41 |
| September 2025 | −0.11 | −0.40 | −0.63 |
NOAA Climate Prediction Center: heat_content_index.txt, against 1981–2010.
The warm water volume of the equatorial Pacific was 3.24 × 10¹⁴ cubic metres above its 1981–2010 average in July 2026, the highest month in NOAA PMEL’s record, which begins in 1980. (FloodRadar’s reading of NOAA PMEL’s wwv.dat, since 1980; data: GTMBA Project Office, NOAA/PMEL.)
Is the atmosphere playing along?
-
Pressure see-saw (SOI)
Tilted the El Niño way (−1.1, August 2026)
NOAA CPC’s standardised index, against 1981–2010. The verdict is FloodRadar’s reading, not NOAA’s.
↓ more El Niño-like
How this is judged: Pressure see-saw (SOI)
FloodRadar’s reading, not NOAA’s: less than half a standard deviation from normal is near normal; half a standard deviation or more below normal tilts the El Niño way, half or more above it the La Niña way. Each tile is judged against its own file’s normal (1981–2010).
-
Trade winds
Tilted the El Niño way (−2.5, August 2026)
NOAA CPC’s standardised index, against 1981–2010. The verdict is FloodRadar’s reading, not NOAA’s.
↓ more El Niño-like
How this is judged: Trade winds
FloodRadar’s reading, not NOAA’s: less than half a standard deviation from normal is near normal; half a standard deviation or more below normal tilts the El Niño way, half or more above it the La Niña way. Each tile is judged against its own file’s normal (1981–2010).
-
Cloud over the central Pacific
Tilted the El Niño way (−37.00 W/m², −2.5 standard deviations, August 2026)
FloodRadar standardisation: the month’s anomaly (against 1991–2020) divided by the 1991–2020 spread of monthly anomalies in NOAA CPC’s file. The verdict is FloodRadar’s reading, not NOAA’s.
↓ more El Niño-like
How this is judged: Cloud over the central Pacific
FloodRadar’s reading, not NOAA’s: less than half a standard deviation from normal is near normal; half a standard deviation or more below normal tilts the El Niño way, half or more above it the La Niña way. Each tile is judged against its own file’s normal (1991–2020).
Is this the hottest the planet has been?
El Niño moves ocean heat into the air, so global temperature usually peaks a few months after the Pacific does. That is why forecasters expect 2027, not 2026, to set the annual record (Met Office, 21 August 2026).
Of the 259 days of 2026 with final data, 50 were the warmest on record for their date in the ERA5 global air-temperature record, which begins in 1940; the latest day, 17 September 2026, was 0.76 °C above the 1991–2020 average and is preliminary. (FloodRadar’s reading of Copernicus’s era5_daily_series_2t_global.csv, since 1940; Copernicus Climate Change Service / ECMWF, ERA5.)
- of the 259 days of 2026 with final data were the warmest on record for their date
- 50
- Global air, ERA5, since 1940
- days in a row, up to the latest final day, the sea surface has been the warmest on record for its date
- 93
- Sea surface 60°S–60°N, ERA5, since 1979 — FloodRadar’s reading
- months since 1940 at or above 1.5 °C over 1850–1900
- 29
- FloodRadar estimate from ERA5 and C3S’s monthly offsets
This chart could not be drawn in this browser. The sentence above and the monthly table below carry its figures.
Copernicus Climate Change Service / ECMWF, ERA5 daily series (era5_daily_series_2t_global.csv and era5_daily_series_sst_60S-60N_ocean.csv). CC BY 4.0. Contains modified Copernicus Climate Change Service information 2026. Neither the European Commission nor ECMWF is responsible for any use that may be made of the Copernicus information or data it contains.
August 2026 was an estimated 1.65 °C above the 1850–1900 level (FloodRadar estimate from ERA5 daily data and C3S’s offset for the month), one of 29 months since 1940 at or above 1.5 °C on this estimate (three months lie within 0.01 °C of the line, where C3S’s own monthly figure can fall either side). Single months above 1.5 °C are not a breach of the Paris limit, which refers to a roughly 20-year average. The first 17 days of September 2026 average about 1.6 °C above 1850–1900 so far, much the same as August (FloodRadar estimate; the latest day is preliminary), above the 1.5 °C level.
This chart could not be drawn in this browser. The sentence above and the table below carry its figures.
| Month | °C above 1850–1900 | Days |
|---|---|---|
| August 2026 | 1.65 | 31 |
| July 2026 | 1.47 | 31 |
| June 2026 | 1.39 | 30 |
| May 2026 | 1.42 | 31 |
| April 2026 | 1.43 | 30 |
| March 2026 | 1.48 | 31 |
| February 2026 | 1.50 — within 0.01 °C of the 1.5 °C line, and below it on the unrounded estimate | 28 |
| January 2026 | 1.47 | 31 |
| December 2025 | 1.42 | 31 |
| November 2025 | 1.54 | 30 |
| October 2025 | 1.55 | 31 |
| September 2025 | 1.47 | 30 |
† Within 0.01 °C of the 1.5 °C line on the unrounded estimate, so this month can print as 1.50 and still sit below it — and C3S’s own monthly figure can fall either side. The count above is judged unrounded, not on the two decimals shown here.
FloodRadar estimate: the mean of ERA5 daily anomalies against 1991–2020 plus C3S’s pre-industrial offset for that calendar month.
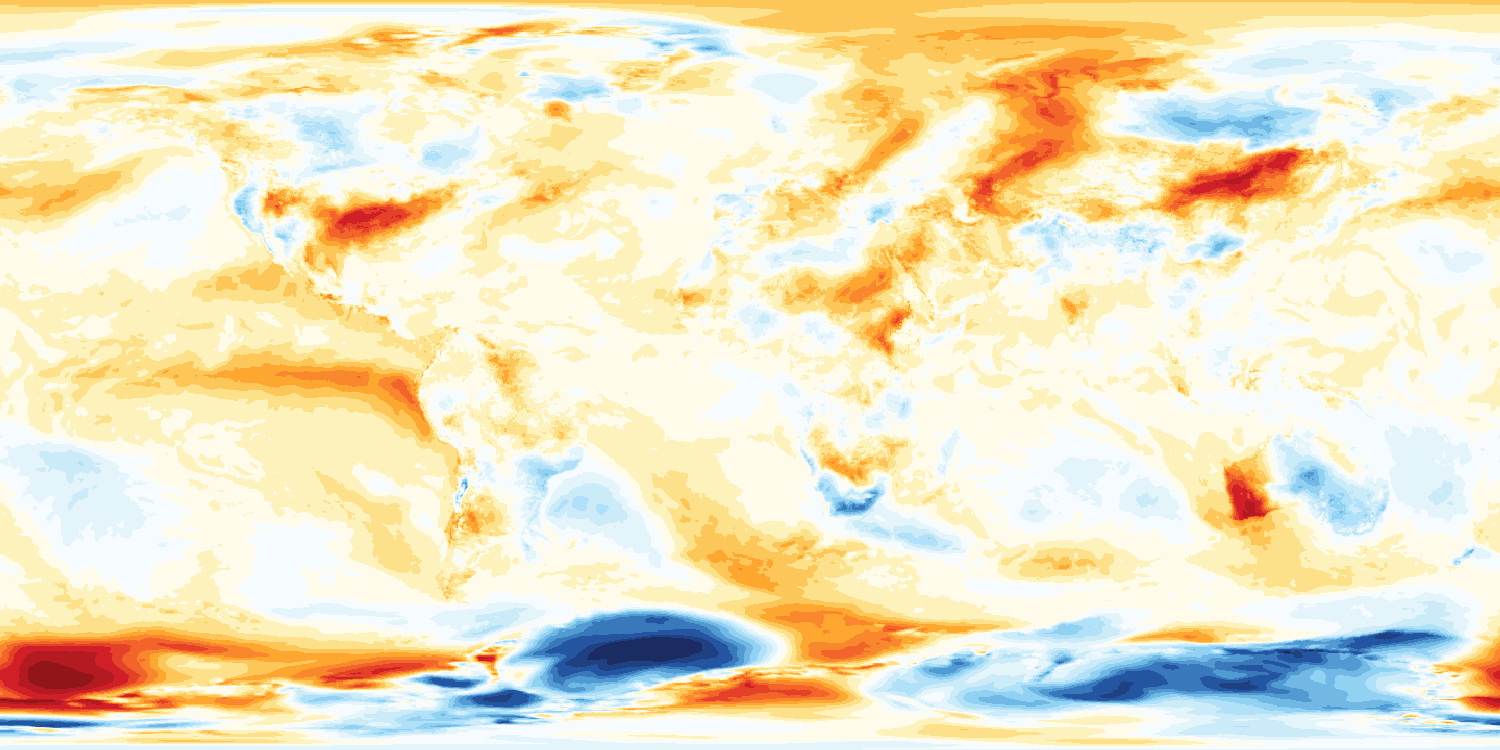

°C against 1991–2020, ECMWF’s scale, ends open beyond ±12. The colour steps run from dark blue, 12 °C or more colder than normal, through pale colours near normal, to dark red, 12 °C or more warmer.
Map: Copernicus Climate Change Service / ECMWF, ERA5 via Climate Pulse, redrawn at half size; coastlines drawn by FloodRadar. CC BY 4.0. Contains modified Copernicus Climate Change Service information 2026. Neither the European Commission nor ECMWF is responsible for any use that may be made of the Copernicus information or data it contains.
What changed
-
Week of 6–12 September 2026
- Niño 3.4 rose 0.2 °C to 2.9 °C above normal, its highest of this event.
- Niño 3 raised its own record to 3.7 °C above normal (FloodRadar’s reading of NOAA CPC’s wksst9120.for, since 1981).
- NOAA issued its September 2026 El Niño discussion on 10 September (status: El Niño Advisory), with new odds, strength and forecast-range tables.
- IRI published its August 2026 collection of model forecasts.
-
Week of 30 August–5 September 2026
- Niño 3.4 rose 0.1 °C to 2.7 °C above normal, its highest of this event.
- Niño 3 raised its own record to 3.5 °C above normal (FloodRadar’s reading of NOAA CPC’s wksst9120.for, since 1981).
- Niño 1+2 set a new record: 4.6 °C above normal, the highest week since September 1981 (FloodRadar’s reading of NOAA CPC’s wksst9120.for, since 1981).
-
Week of 23–29 August 2026
- Niño 3.4 held at 2.6 °C above normal.
- Niño 3 set a new record: 3.4 °C above normal, the highest week since September 1981 (FloodRadar’s reading of NOAA CPC’s wksst9120.for, since 1981).
-
Week of 16–22 August 2026
- Niño 3.4 held at 2.6 °C above normal.
-
Week of 9–15 August 2026
- Niño 3.4 rose 0.1 °C to 2.6 °C above normal, its highest of this event.
-
Week of 2–8 August 2026
- Niño 3.4 rose 0.1 °C to 2.5 °C above normal, its highest of this event.
-
Week of 26 July–1 August 2026
- Niño 3.4 rose 0.2 °C to 2.4 °C above normal, its highest of this event.
-
Week of 19–25 July 2026
- Niño 3.4 rose 0.1 °C to 2.2 °C above normal, its highest of this event.
Can I trust it today?
- 21 On time
- 0 Late
- 0 Switched off
- 0 No data yet
Each source is judged on its own clock: it is late when its newest data is older than that source normally runs behind. These figures were built 19 September 2026, 17:25 UTC.
| Source | State | Latest data |
|---|---|---|
| Weekly sea temperatures in the four Niño regions (OISST v2.1, against 1991–2020)NOAA Climate Prediction Center | On time | Latest data: 12 September 2026Next expected 21 September 2026 |
| Weekly relative Niño indices (tropics-wide warming removed)NOAA Climate Prediction Center | On time | Latest data: 12 September 2026Next expected 21 September 2026 |
| Oceanic Niño Index, three-month seasons (ERSST v6)NOAA Climate Prediction Center | On time | Latest data: 31 August 2026Next expected 5 October 2026 |
| Relative Oceanic Niño Index — NOAA’s official El Niño measure since February 2026NOAA Climate Prediction Center | On time | Latest data: 31 August 2026Next expected 5 October 2026 |
| Monthly sea temperatures in the four Niño regions (OISST v2.1)NOAA Climate Prediction Center | On time | Latest data: 31 August 2026Next expected 5 October 2026 |
| Monthly relative Niño indicesNOAA Climate Prediction Center | On time | Latest data: 31 August 2026Next expected 5 October 2026 |
| Southern Oscillation Index (Tahiti minus Darwin air pressure)NOAA Climate Prediction Center | On time | Latest data: 31 August 2026Next expected 5 October 2026 |
| Central Pacific trade-wind index (850 hPa)NOAA Climate Prediction Center | On time | Latest data: 31 August 2026Next expected 5 October 2026 |
| Central Pacific outgoing longwave radiation (cloud and rain over the dateline)NOAA Climate Prediction Center | On time | Latest data: 31 August 2026Next expected 5 October 2026 |
| Upper-ocean heat content along the equator (top 300 m, against 1981–2010)NOAA Climate Prediction Center | On time | Latest data: 31 August 2026Next expected 5 October 2026 |
| Warm water volume of the equatorial Pacific (water warmer than 20 °C; 5°S–5°N, 120°E–80°W; against 1981–2010)GTMBA Project Office, NOAA/PMEL | On time | Latest data: 31 July 2026Next expected 20 September 2026 |
| Daily Niño 3.4 sea temperature (OISST v2.1)Climate Reanalyzer, University of Maine · NOAA OISST v2.1 | On time | Latest data: 18 September 2026Next expected 22 September 2026 |
| Global surface air temperature, every day since 1940 (ERA5)Copernicus Climate Change Service / ECMWF (ERA5) | On time | Latest data: 17 September 2026Next expected 20 September 2026 |
| Sea surface temperature, 60°S–60°N, every day since 1979 (ERA5)Copernicus Climate Change Service / ECMWF (ERA5) | On time | Latest data: 17 September 2026Next expected 20 September 2026 |
| NOAA’s monthly El Niño discussion and alert statusNOAA Climate Prediction Center | On time | Latest data: issued 10 September 2026Next expected 8 October 2026 |
| NOAA’s odds of El Niño, neutral and La Niña for the next nine seasonsNOAA Climate Prediction Center | On time | Latest data: issued 10 September 2026Next expected 8 October 2026 |
| NOAA’s odds for how strong the event will beNOAA Climate Prediction Center | On time | Latest data: issued 10 September 2026Next expected 8 October 2026 |
| NOAA’s forecast range for the relative Niño 3.4 indexNOAA Climate Prediction Center | On time | Latest data: issued 10 September 2026Next expected 8 October 2026 |
| Forecasts from IRI’s collection of computer modelsInternational Research Institute for Climate and Society, Columbia University | On time | Latest data: 31 August 2026Next expected 19 September 2026 |
| Daily map of sea temperature against normal, quarter-degree (OISST v2.1, against 1971–2000)NOAA NCEI OISST v2.1, served by NOAA CoastWatch | On time | Latest data: 18 September 2026Next expected 20 September 2026 |
| Daily map of air temperature against normal (ERA5)Copernicus Climate Change Service / ECMWF (ERA5) | On time | Latest data: 17 September 2026Next expected 20 September 2026 |
“NOAA’s official El Niño measure since February 2026” is the Climate Prediction Center’s own words: CPC adopts Relative Oceanic Niño Index (RONI) for reliable, responsive monitoring and tracking of ENSO, February 2026. The traditional ONI is still published, and this page shows both.
What each figure is measured against
| Figure | Against |
|---|---|
| Weekly and monthly Niño values, traditional and relative | 1991–2020 |
| Daily Niño 3.4 (FloodRadar calculation) | 1991–2020 |
| Oceanic Niño Index (ONI), three months | centred 30-year periods |
| Relative Oceanic Niño Index (RONI), three months | 1991–2020, with the tropics-wide mean removed and rescaled |
| Upper-ocean heat | 1981–2010 |
| Warm water volume | 1981–2010 |
| Pressure see-saw (SOI) | 1981–2010 |
| Trade winds | 1981–2010 |
| Cloud over the central Pacific | 1991–2020 |
| The globe, its poster and the equator strip | 1971–2000 |
| Global air and sea-surface temperature (ERA5) | 1991–2020 |
| Global temperature against the pre-industrial level | FloodRadar estimate: the mean of ERA5 daily anomalies against 1991–2020 plus C3S’s pre-industrial offset for that calendar month. |
| The daily air-temperature map (Copernicus Climate Pulse) | 1991–2020 |
No record, rank or same-scale comparison on this page mixes two of these base periods. There is one deliberate exception, and its whole subject is the difference between them: ONI minus RONI, which subtracts an index measured against 1991–2020 with the tropics taken out from one measured against moving 30-year periods.
How records are judged
Records are FloodRadar’s reading of NOAA CPC’s files, judged at the precision NOAA publishes: wksst9120.for (since September 1981) and rel_wksst9120.txt (since September 1981) for the weekly figures; sstoi.indices (since 1982) and rel_mthsst9120.txt (since 1981) for the monthly figures; oni.ascii.txt (since 1950) and RONI.ascii.txt (since 1950) for the three-month figures. The daily figure is FloodRadar’s calculation from Climate Reanalyzer’s NOAA OISST v2.1 series (since 1981). Provisional and preliminary values cannot set or lose a record.
FloodRadar’s rule: this event began with the first week of the current unbroken run of weekly Niño 3.4 readings 0.5 °C or more above normal (NOAA CPC weekly OISST v2.1, against 1991–2020). On that rule it began in the week of 12–18 April 2026.
Sources and licences
-
NOAA Climate Prediction Center; NOAA NCEI OISST v2.1, served by NOAA CoastWatch
wksst9120.for, rel_wksst9120.txt, oni.ascii.txt, RONI.ascii.txt, sstoi.indices, rel_mthsst9120.txt, soi, cpac850, cpolr.mth.91-20.ascii, heat_content_index.txt, ensodisc.txt, probabilities, strengths, outlook, ncdcOisst21NrtAgg_LonPM180.csv
US Government work in the public domain (National Weather Service terms: free to use for any lawful purpose; no endorsement by NOAA is implied).
-
GTMBA Project Office, NOAA/PMEL
US Government work in the public domain. NOAA asks users to acknowledge the GTMBA Project Office of NOAA/PMEL.
-
Climate Reanalyzer, University of Maine · NOAA OISST v2.1
CC BY 4.0. Climate Reanalyzer, Climate Change Institute, University of Maine; underlying data NOAA OISST v2.1.
-
Copernicus Climate Change Service / ECMWF (ERA5)
era5_daily_series_2t_global.csv, era5_daily_series_sst_60S-60N_ocean.csv, climpulse_status.json
CC BY 4.0. Contains modified Copernicus Climate Change Service information 2026. Neither the European Commission nor ECMWF is responsible for any use that may be made of the Copernicus information or data it contains.
-
International Research Institute for Climate and Society, Columbia University
CC BY 4.0. ENSO Forecast Data © 2002-2026 by International Research Institute for Climate and Society is licensed under Creative Commons Attribution 4.0 International. Values read from the published figure; redrawn by FloodRadar.
-
NOAA OISST v2.1
Huang et al. 2020, doi:10.1175/JCLI-D-20-0166.1. Daily Niño 3.4: ClimateReanalyzer.org, Climate Change Institute, University of Maine · NOAA OISST 2.1 (FloodRadar calculation).
-
Britain: the winters, the live figures and the rainfall normals
Environment Agency flood alerts and warnings (FloodRadar’s archive since 2006) and Environment Agency river and rainfall readings, under the Open Government Licence v3.0. Scottish rain gauges: contains SEPA data © Scottish Environment Protection Agency and database right 2025. Average rainfall: Met Office HadUK-Grid 1991–2020 monthly normals; contains public sector information licensed under the Open Government Licence v3.0. More on FloodRadar’s data sources.
-
Met Office
Quoted on this page: An ‘unprecedented’ El Niño and its implications for the weather forecast (21 August 2026), and the Met Office line carried on El Niño 2026–27, explained, whose source list names each item.
-
The globe
Earth textures from the three.js examples (MIT); three.js r160 (MIT). Coastlines on the air-temperature map drawn by FloodRadar from the same Earth texture.
FloodRadar is not part of NOAA, IRI, Copernicus or ECMWF, and nothing on this page is an official product of any of them. Every record, rank and count is FloodRadar’s own reading of their files, and says so where it appears.