Drag to turn the Earth

Sea surface warmer than the 1991–2020 average

The Pacific is running a fever. Britain will feel it this winter.

El Niño 2026–27 is on course to be the strongest ever measured. This page explains what that is, how it works, where it is right now, and what it most likely means for rain, storms and rivers in the UK, and when.

Niño 3.4 in August
+1.8 °C
Chance of a very strong event
over 90%
Expected peak
Nov–Jan
Lasts until at least
Feb 2027
Start with where it is

Where it is

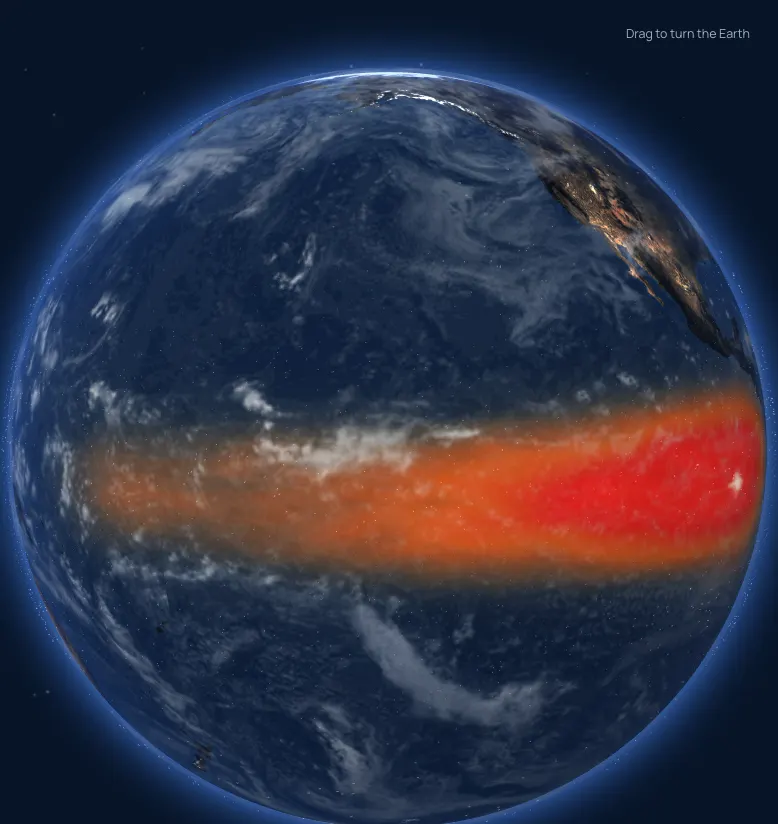
El Niño lives in a strip of the Pacific along the equator wider than the whole Atlantic. Forecasters watch one rectangle of it above all, Niño 3.4, between 170° W and 120° W. In August 2026 its surface ran 1.8 °C warmer than the 1991–2020 average. Off the coast of Peru the water was 3.4 °C warmer than normal.

The glow on the globe is that warm water. It is not a shade of colour on a map: it is heat, enough to change where clouds form across a third of the planet.

What broke

Normally the trade winds blow steadily from east to west along the equator. They drag sun-warmed surface water towards Indonesia and pull cold water up from the deep off Peru. In an El Niño the trades falter. The warm water they were holding back sloshes east in slow waves that take two to three months to cross the ocean, and the rain that sits over the warmest water goes with it.

Drag the globe to follow the wind. The streaks are air; the faster they move, the brighter they are.

The whole planet feels it

Move that much heat and rain and the atmosphere reroutes around it. The pattern repeats event after event: drought in Indonesia, Australia, India and southern Africa; floods in Peru and East Africa; a wet winter across the southern United States; a quiet Atlantic hurricane season. In 2026 the Indian monsoon has already run well below normal and the Atlantic had produced three named storms by late August.

Tap a marker on the globe, or read the list.

And Britain

Britain sits at the far end of the chain. El Niño’s clearest effect here is on the jet stream, the river of fast air that steers Atlantic storms. In the first half of winter it tends to run stronger and point at the British Isles. That means named storms in quick succession, milder air, and rain on ground that never gets the chance to dry out.

Late in the winter the picture can flip. El Niño winters carry a somewhat higher chance of a weakened polar vortex, which opens the door to cold, blocked spells in January and February. The Met Office calls that link real but not strong.

Why this one is different

The forecast models agree, and the Met Office says it has never seen an El Niño signal this intense. NOAA gives better than a 90% chance of a very strong event this winter and a 75% chance of a historic one. Met Office forecasts for Niño 3.4 run to more than 3 °C, beyond anything in the record since 1950. The World Meteorological Organization expects it to last until at least February 2027 and to peak around the turn of the year.

“We should be clear that this is an unprecedented event. I have never seen an El Niño signal this intense in our forecasts.”

Professor Adam Scaife, head of long-range forecasting, Met Office, 21 August 2026

How it works

A slice through the Pacific along the equator, Indonesia on the left, South America on the right. Switch between the three states and watch the wind, the warm water and the rain move.

In a normal year the trade winds blow west along the equator. Warm water piles up around Indonesia, where the sea stands about half a metre higher and the warm layer runs deep. Off Peru, cold water rises from below. Air rises over the warm pool and rains; it sinks over the cooler east and stays dry.

Where the numbers stand

NOAA’s Climate Prediction Center keeps the score: an “El Niño Advisory” has been in force since 11 June 2026. These are its figures for August 2026, issued on 10 September 2026.

Niño 3.4
+1.8 °C

The standard yardstick. An event counts as very strong at +2.0.

Niño 3
+2.5 °C

Further east, already past the very-strong line.

Niño 1+2
+3.4 °C

The coast of Peru and Ecuador, where the anomaly is largest.

Niño 4
+0.1 °C

The western Pacific, barely warmer than normal: the heat is in the east.

The big five, month by month. The Oceanic Niño Index for the four strongest events since 1950 and for 2026, from the January before each peak. The shaded band is where the forecasts put the coming months.
NOAA Climate Prediction Center, ERSSTv6. Forecast band: NOAA (10 Sep 2026) and Met Office (21 Aug 2026).

What to expect in the UK, and when

What the Met Office, NOAA and the WMO have actually said, phase by phase, and what each phase tends to do to rivers.

  1. Now to November 2026

    A wetter, warmer autumn

    The Met Office puts the chance of a warm and wet autumn at one-and-a-half to two times what it would normally be, with windier weather more likely later in the season.

    Autumn rain lands on ground that dries out over summer, so early on it soaks in. Watch for the change: once soils are wet, every band of rain pushes rivers up faster and further.

    How sure: Firm on El Niño, moderate on the UK

  2. November 2026 to January 2027

    The peak: stormier, and the busiest window for rivers

    The event is forecast to peak around the turn of the year. Historically this is when El Niño loads the Atlantic jet stream, and the Met Office already sees signals for increased rainfall and storminess in November and December.

    Named storms in quick succession on saturated catchments is how Britain gets its worst river floods: December 2015 and October 2023 to January 2024 both happened in El Niño winters. Long, wet spells matter more than any single storm.

    How sure: Firm on El Niño, moderate on the UK

  3. January to February 2027

    Late winter: the cold door opens a little

    El Niño winters carry a somewhat higher chance of a weak polar vortex and a sudden stratospheric warming, which can bring colder, calmer spells to Britain late in the winter. The Met Office calls the link a real one but not a strong one.

    Cold snaps pause river rises; the thaw that follows, especially with rain on snow, does the opposite. High groundwater after a wet autumn keeps chalk rivers and springs running high for months.

    How sure: Lower

  4. Spring and summer 2027

    The event fades, the heat stays

    El Niño events usually decay through spring. The Met Office expects 2027 to become the warmest year on record and, for a time, more than 1.5 °C above the pre-industrial climate, with knock-on effects lasting through the year.

    Whether spring floods follow depends on how wet the winter leaves the ground. The Easter 1998 floods came as that El Niño faded.

    How sure: Lower

Seventy-six years of the Pacific, and what Britain saw

Every El Niño and La Niña since 1950. Warm seasons are orange, cool seasons blue. Choose an event to read what happened here and around the world.

Oceanic Niño Index, NOAA Climate Prediction Center. Three-month running mean of the Niño 3.4 anomaly; 2026 to June–August.

1982–83

Very strong, peak +2.2 °C in Dec 1982 – Jan 1983

The one that caught science by surprise

In Britain

Britain barely noticed. The winter of 1982–83 was mild and mostly unremarkable here, a useful reminder that El Niño loads the dice for the UK rather than throwing them.

Around the world

Catastrophic floods on the coasts of Peru and Ecuador, drought across eastern Australia that ended in the Ash Wednesday bushfires of February 1983, and a failed anchovy fishery. Forecasters had not seen it coming; the ocean-monitoring buoys that now stretch across the Pacific were built in its aftermath.

1997–98

Very strong, peak +2.4 °C in Nov 1997 – Jan 1998

The event that made El Niño a household name

In Britain

A mild, damp winter with a record-warm February, then the Easter floods of 9–10 April 1998 as the event faded: a slow-moving band of rain sat over the Midlands, five people died and thousands of properties around Northampton, Leamington Spa and Evesham flooded.

Around the world

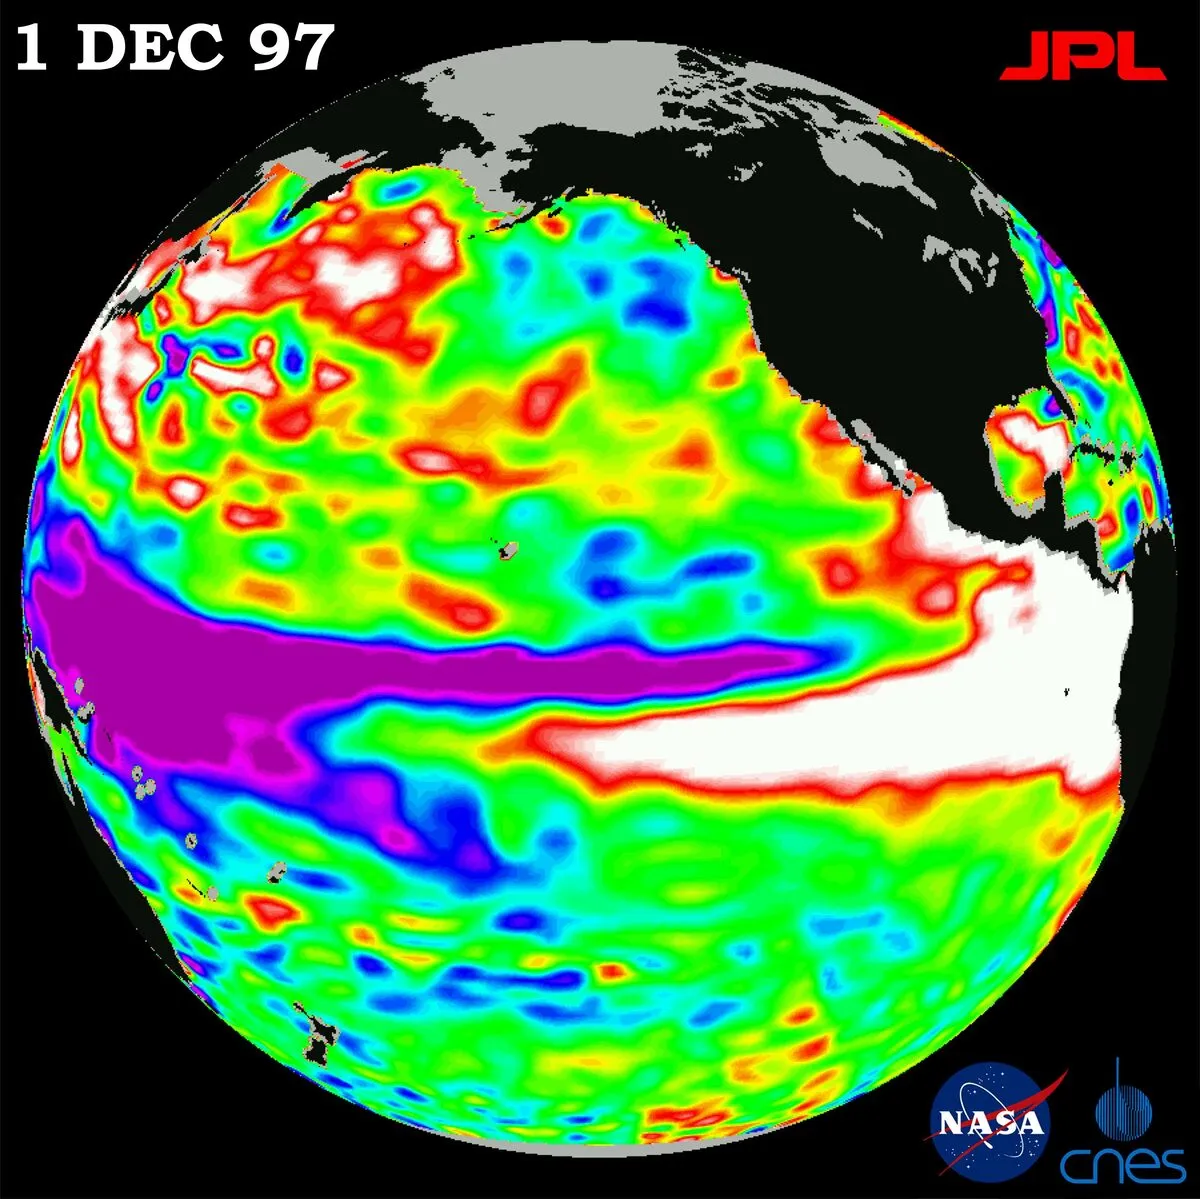
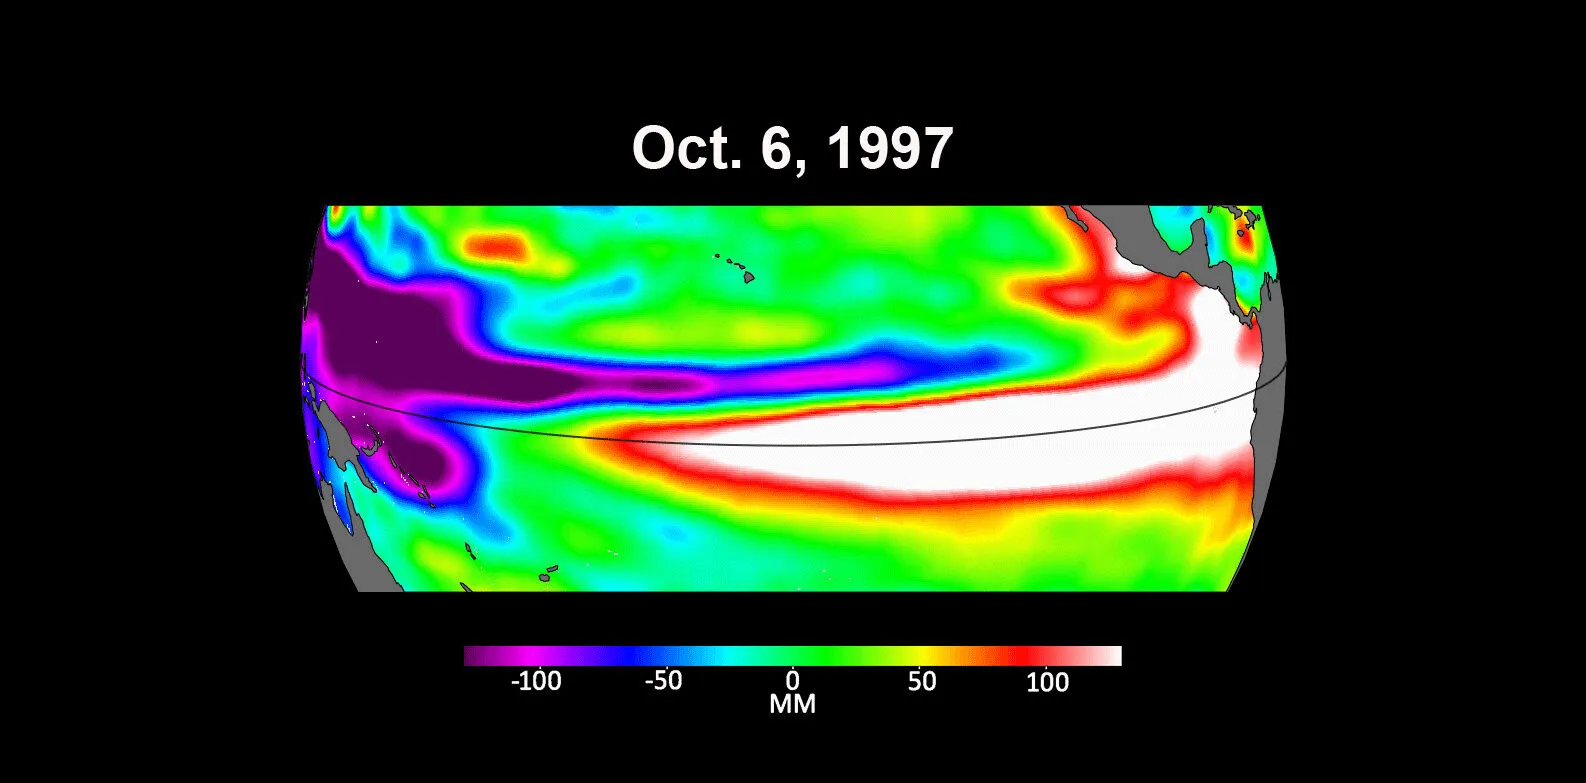
Sea level off Peru stood higher than normal by tens of centimetres as warm water sloshed east. Torrential rain destroyed roads and bridges in northern Peru and Ecuador, forest fires and haze choked Indonesia, floods hit Kenya and Somalia, and worldwide losses ran to tens of billions of dollars.

Globe view of the Pacific from the TOPEX/Poseidon satellite showing a white and red tongue of high sea level along the equator, 1 December 1997.
Sea-surface height on 1 December 1997: the white tongue along the equator is warm water standing higher than normal. NASA/JPL-Caltech, TOPEX/Poseidon, Public domain.
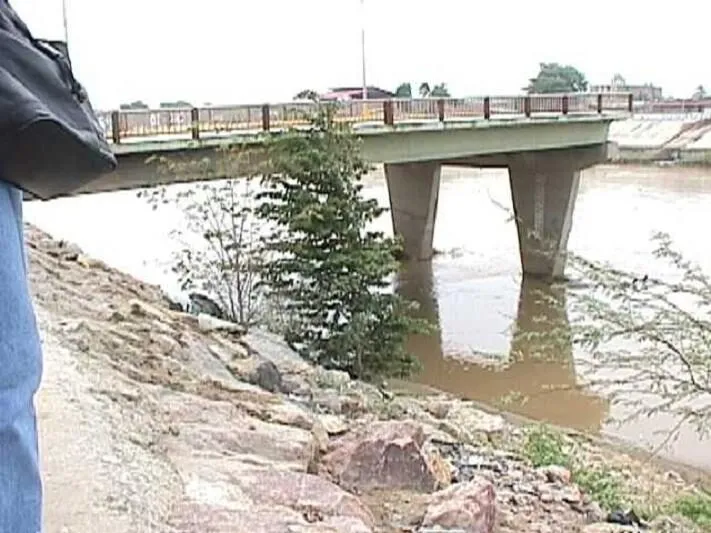
The remains of a road bridge in Piura, Peru, its deck collapsed into the river.
The old Bolognesi bridge at Piura, Peru, destroyed by El Niño floods in 1998. Alfredobi, via Wikimedia Commons, Public domain.

2009–10

Moderate, peak +1.5 °C in Nov 2009 – Jan 2010

The winter that did both things

In Britain

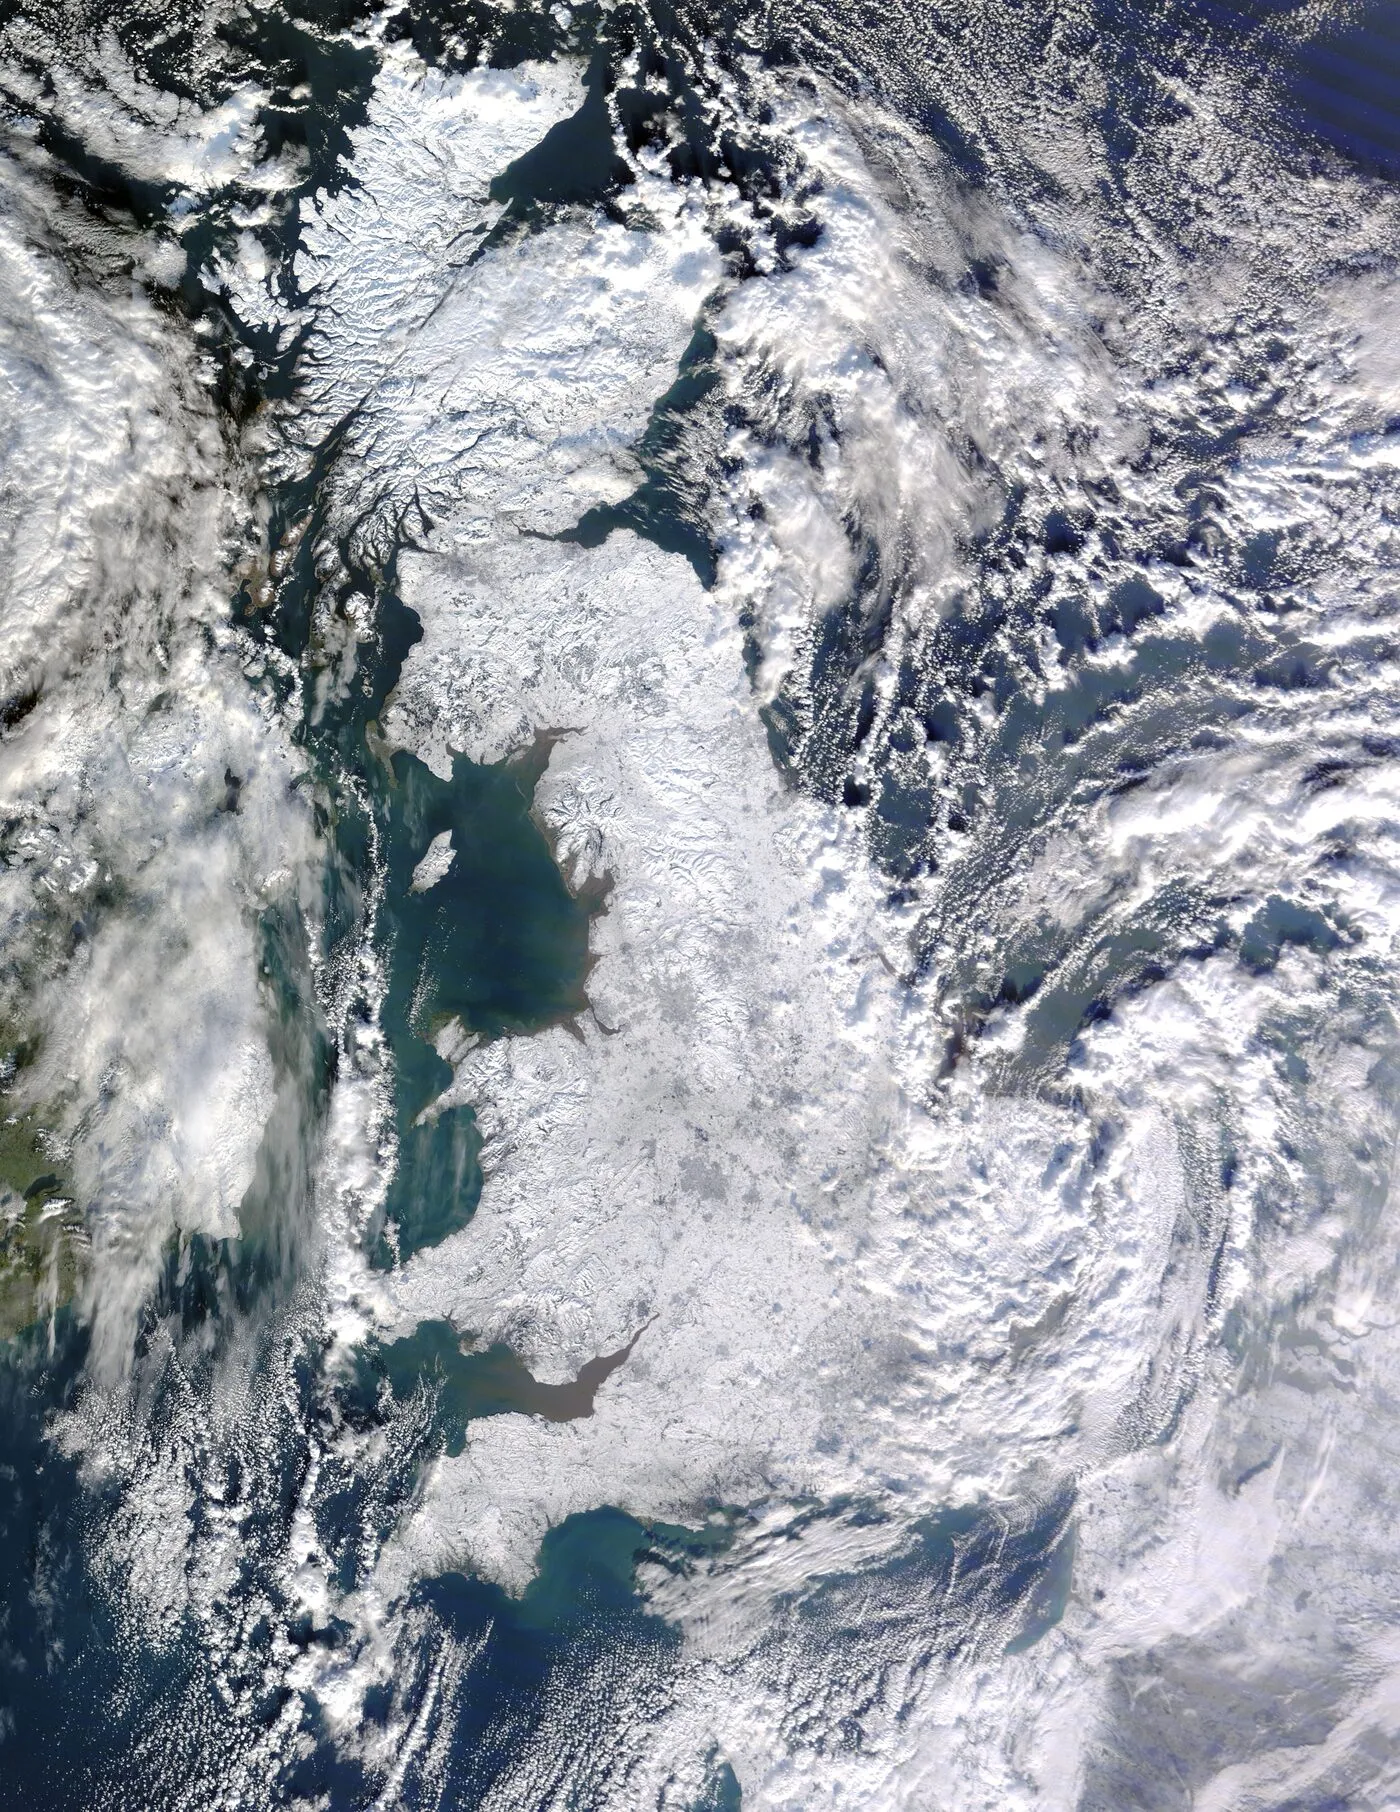
On 19 November 2009, 316 mm of rain fell at Seathwaite in Borrowdale in 24 hours, a UK record at the time, and Cockermouth and Workington flooded. Six weeks later the same El Niño winter turned bitterly cold: the coldest UK winter for three decades, with the whole island under snow on 7 January 2010. Wet early winter, cold late winter, in one season.

Around the world

A moderate event by Pacific standards, but the northern winter of 2009–10 brought deep cold to Europe and the eastern United States while Canada had its warmest winter on record, the classic El Niño fingerprint on the northern hemisphere.

Satellite view of Great Britain almost entirely white with snow, 7 January 2010.
Great Britain under snow, 7 January 2010, in the El Niño winter of 2009–10. NASA image by Jeff Schmaltz, MODIS Rapid Response Team, Public domain.

2015–16

Very strong, peak +2.6 °C in Nov 2015 – Jan 2016

Desmond, Eva, Frank

In Britain

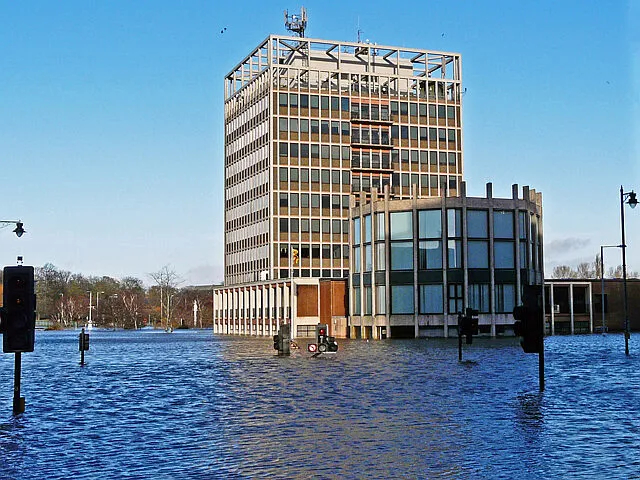
Storm Desmond dropped 341 mm on Honister Pass in 24 hours on 5–6 December 2015, the UK record that still stands, and put Carlisle, Cockermouth, Keswick and Lancaster under water. Storm Eva brought the Boxing Day floods to Leeds, York and the Calder Valley; Storm Frank followed within the week. December 2015 was the wettest calendar month the UK had ever recorded.

Around the world

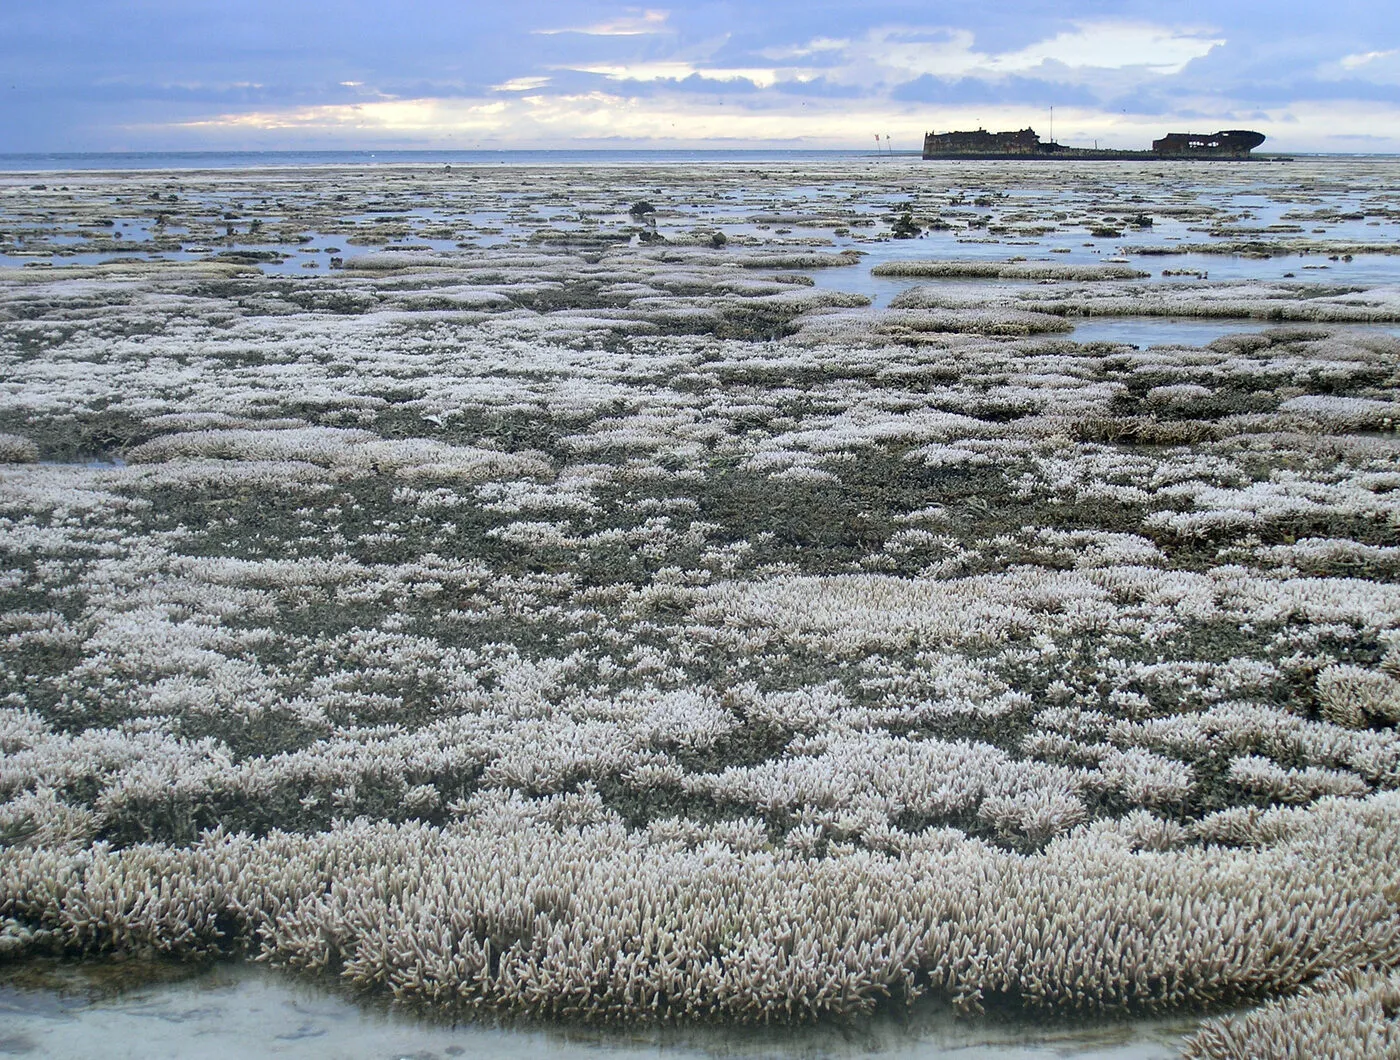
The strongest El Niño since 1997–98. Fires and haze across Indonesia, drought in Ethiopia and southern Africa, mass coral bleaching on the Great Barrier Reef in early 2016, and 2016 became the warmest year then on record.

Storm pages: Desmond, Eva, Frank

Carlisle Civic Centre standing in brown floodwater after Storm Desmond.
Carlisle Civic Centre amid floodwater, 6 December 2015, after Storm Desmond. Rose and Trev Clough, via geograph.org.uk, CC BY-SA 2.0.
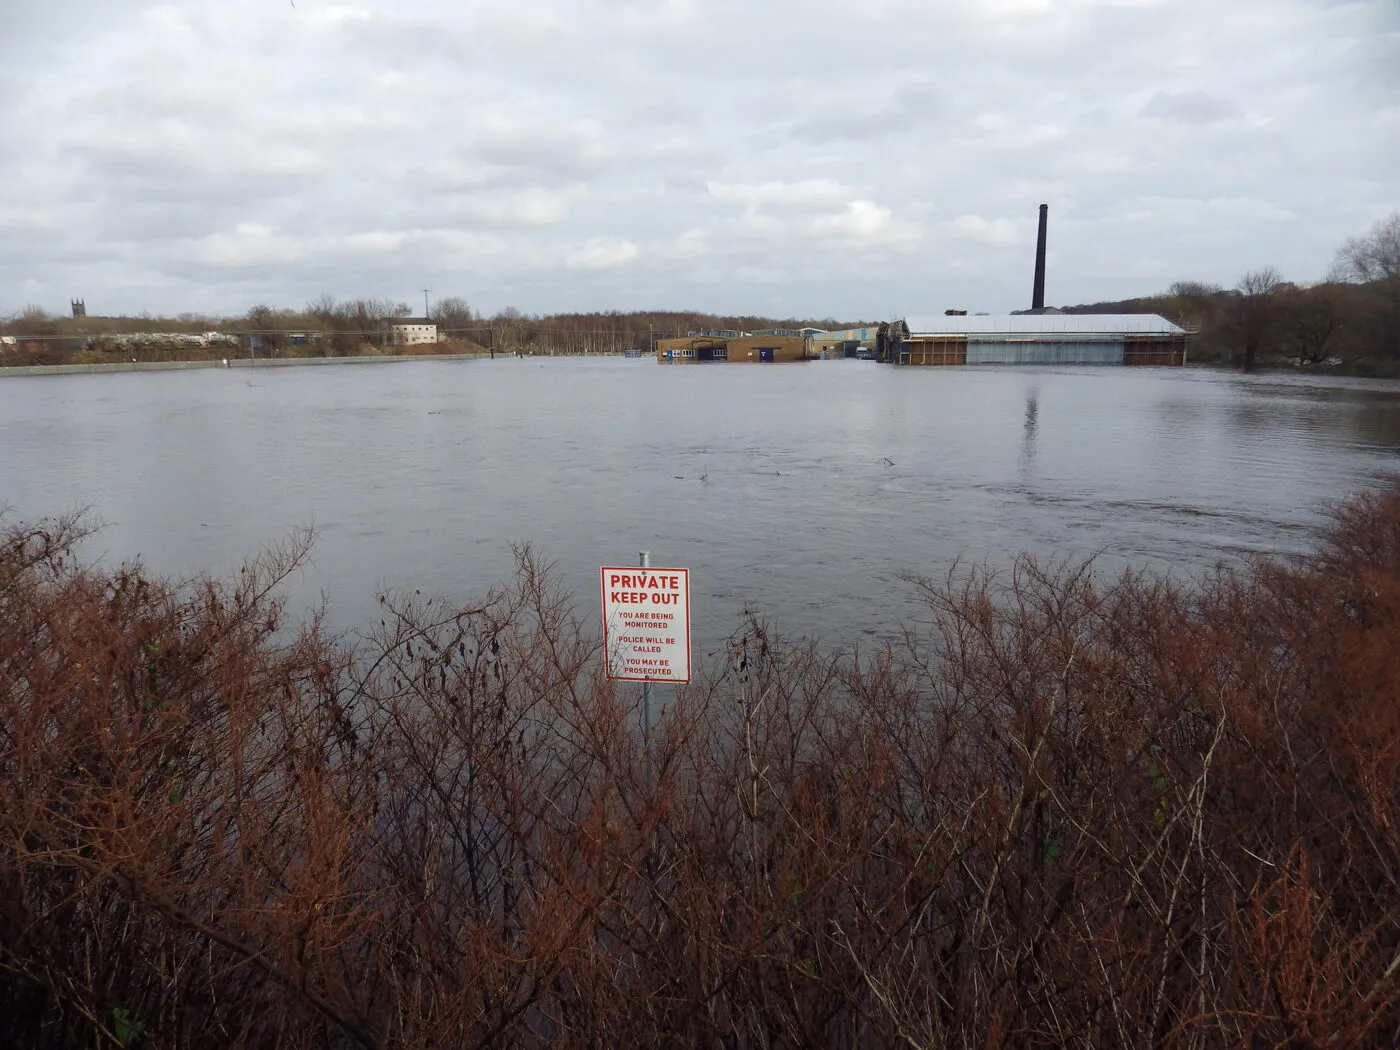
Flooded fields stretching to a distant mill chimney on Boxing Day 2015.
The Boxing Day floods of 2015, after Storm Eva. Nigel Homer, via geograph.org.uk, CC BY-SA 2.0.

2023–24

Strong, peak +2.0 °C in Nov 2023 – Jan 2024

Babet, Ciarán, Henk, Isha, Jocelyn

In Britain

Storm Babet parked over eastern Scotland on 18–21 October 2023; red rain warnings were issued and Brechin was evacuated when the South Esk overtopped its defences. Ciarán followed in November, Henk flooded the Severn and Trent on 2 January 2024, and Isha and Jocelyn arrived within days of each other in late January. The 18 months to March 2024 were the wettest England has recorded. FloodRadar’s archive counts more flood alerts and warnings that winter than any other since 2006.

Around the world

2023 became the warmest year on record and 2024 warmer still. The Amazon fell to record low levels, drought squeezed the Panama Canal, and southern Africa lost harvests to a failed rainy season.

Storm pages: Babet, Ciaran, Henk, Isha, Jocelyn

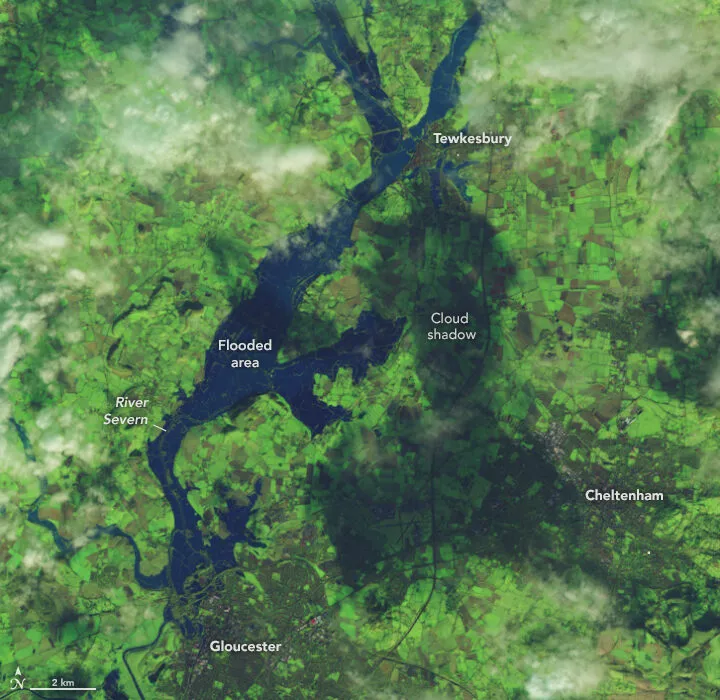
Satellite image of the River Severn spread wide across its floodplain between Tewkesbury and Gloucester.
The Severn in flood between Tewkesbury and Gloucester on 3 January 2024, the day after Storm Henk. NASA Earth Observatory, Lauren Dauphin, using Landsat data from the US Geological Survey, Public domain.
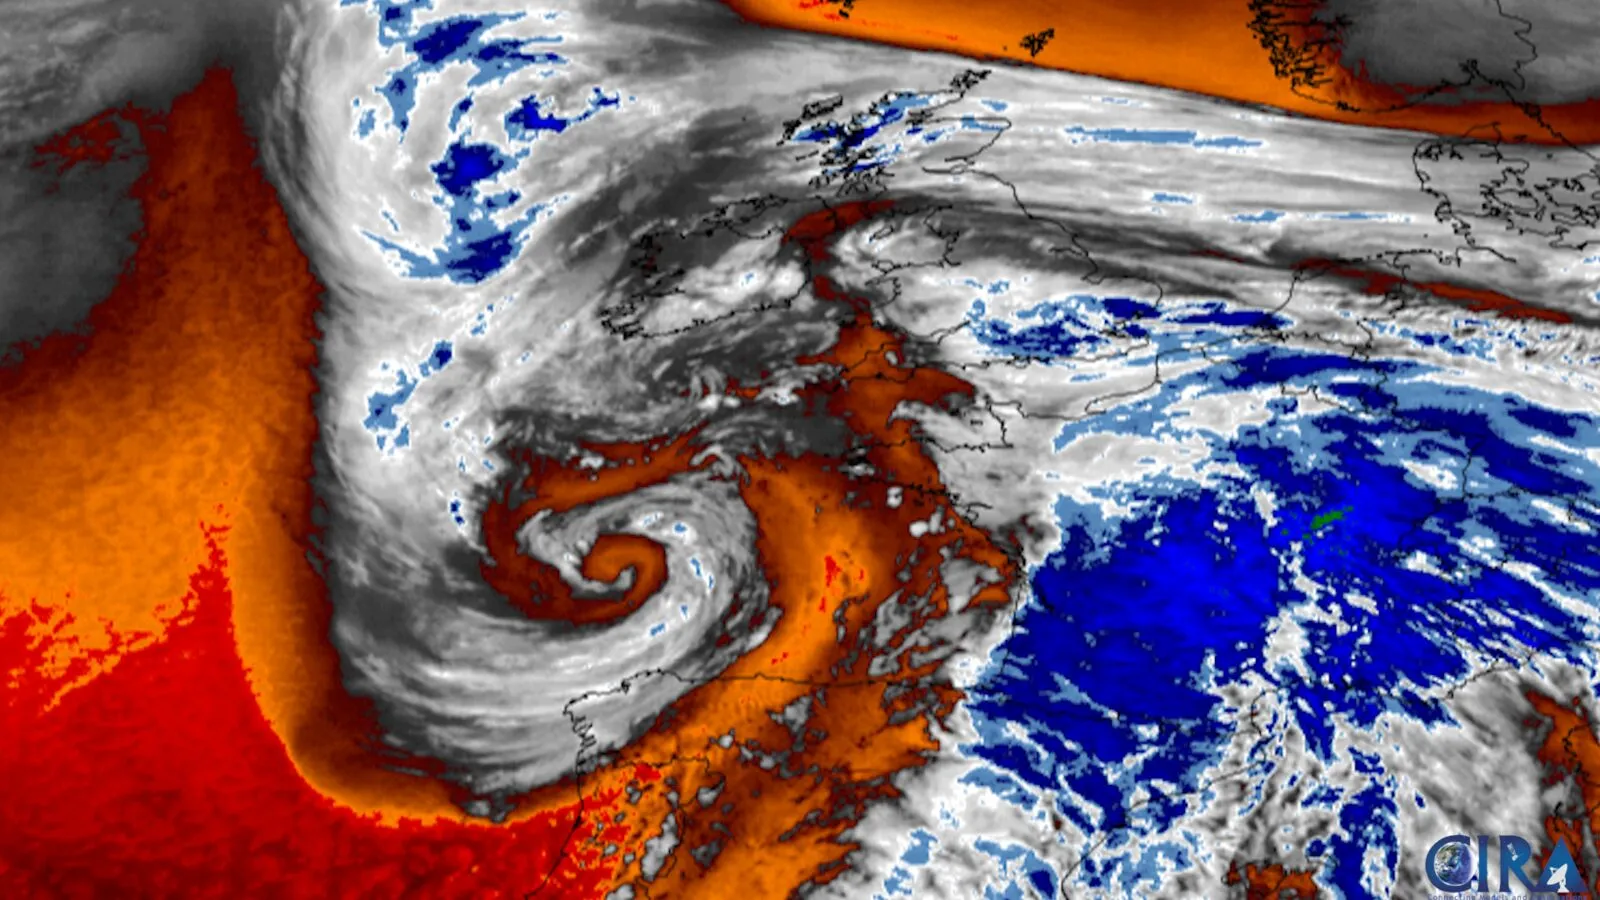
Satellite water-vapour image of Storm Babet spiralling over the British Isles.
Storm Babet in Meteosat water-vapour imagery, 20 October 2023. CSU/CIRA and EUMETSAT, Public domain.

2026–27

Forecast very strong to historic; +1.8 °C so far, for JJA 2026

You are here

The chapter that has not been written yet. Everything above is the pattern; what actually happens in Britain this winter will be decided by individual storms, weeks apart, on catchments that are either dry or already full. FloodRadar’s gauges, rain radar and alerts exist to tell you which.

Warnings in force now, rivers rising now, the next 24 hours.

Who it reached last time

El Niño is the largest natural swing in the world’s weather from one year to the next. These are three of its signatures.

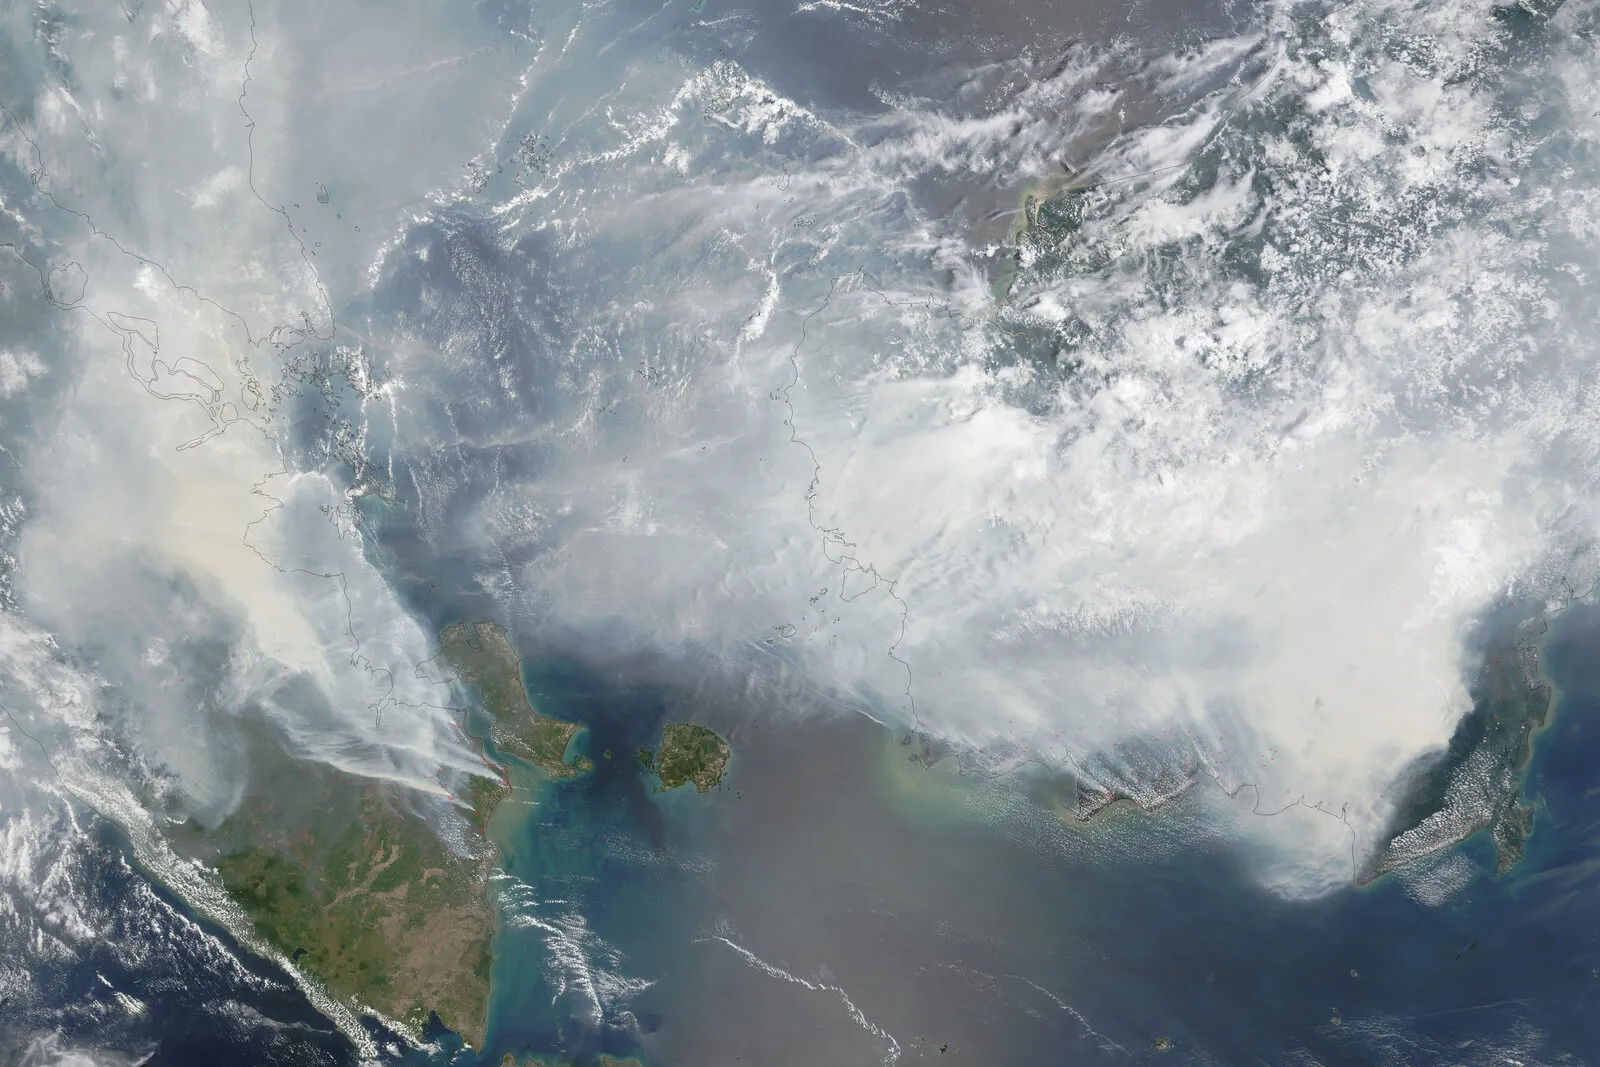
Satellite image of Sumatra and Borneo hidden under grey smoke with red fire markers.
Smoke from peat and forest fires over Sumatra and Borneo, 24 September 2015, in an El Niño drought. NASA Earth Observatory, Adam Voiland and Jeff Schmaltz, MODIS, Public domain.
A field of bleached white coral on the Great Barrier Reef.
Bleached coral on the Great Barrier Reef, February 2016. Oregon State University, CC BY-SA 2.0.
The remains of a road bridge in Piura, Peru, its deck collapsed into the river.
The old Bolognesi bridge at Piura, Peru, destroyed by El Niño floods in 1998. Alfredobi, via Wikimedia Commons, Public domain.
Three maps of Pacific sea level in early October 1997, 2015 and 2023, each with a red band of high water along the equator.
Pacific sea level in early October of 1997, 2015 and 2023. Red and white is higher than average, blue and purple lower. NASA/JPL-Caltech, Public domain.

Our own record: every winter since 2006, counted

Each bar is the number of flood alerts, warnings and severe warnings the Environment Agency raised in England between October and March, from FloodRadar’s archive. The colour is the state of the Pacific that winter.

FloodRadar flood-warning archive (Environment Agency data), summed 13 September 2026. Pacific state from the NOAA ONI for November–January.

In this archive, El Niño winters average about 4,120 alerts and warnings, La Niña winters about 2,740, and neutral winters about 4,170. 2 of the three busiest winters were El Niño winters. Read it as context rather than as a forecast: the number of areas that can be warned has grown over twenty years, and one wet fortnight can outweigh a whole season’s pattern.

The words, briefly

ENSO
The El Niño–Southern Oscillation: the whole swing between El Niño, neutral and La Niña. “Southern Oscillation” is the see-saw in air pressure between the western and eastern Pacific that goes with it.
El Niño
The warm phase. The tropical Pacific east of the dateline runs warmer than normal, the trade winds weaken and the rain moves east. Declared when the Niño 3.4 region is at least 0.5 °C above average and expected to stay there.
La Niña
The cool phase. Stronger trade winds, colder water in the east, and rain piled up over Indonesia and Australia.
Niño 3.4
A rectangle of ocean along the equator from 170° W to 120° W. Its sea-surface temperature, compared with the 1991–2020 average, is the standard yardstick for El Niño.
ONI
The Oceanic Niño Index: the Niño 3.4 anomaly averaged over three months. NOAA calls an event weak at 0.5 °C, moderate at 1.0 °C, strong at 1.5 °C and very strong at 2.0 °C.
Thermocline
The boundary between the sun-warmed surface layer and the cold deep ocean. Normally shallow off Peru and deep near Indonesia; El Niño flattens it.
Walker circulation
The east–west loop of air over the tropical Pacific: rising over the warmest water, sinking over the coolest. El Niño shifts the rising branch east.
Jet stream
The river of fast air about 10 km up that steers Atlantic storms. When it strengthens and points at Britain, storms arrive in quick succession.
Sudden stratospheric warming
A breakdown of the winter polar vortex 30 km up. It often, though not always, brings a cold, blocked spell to Britain a few weeks later. Somewhat more likely in El Niño winters.

Where every number comes from

  1. ENSO diagnostic discussion NOAA Climate Prediction Center, 10 September 2026
  2. Oceanic Niño Index (ERSSTv6), 1950 to present NOAA Climate Prediction Center, read 13 September 2026
  3. El Niño set to become very strong, raising risks of extreme weather in 2027 World Meteorological Organization, 3 September 2026
  4. El Niño declared for 2026 as Pacific warms Met Office, 11 June 2026
  5. An ‘unprecedented’ El Niño and its implications for the weather forecast Met Office, 21 August 2026
  6. What does the latest long-range forecast tell us and what role could El Niño play this autumn? Met Office, 11 September 2026
  7. Stormy autumn, cold winter: how might El Niño affect the UK weather? BBC Weather, Ben Rich, 3 September 2026
  8. El Niño and La Niña, explained Met Office, undated
  9. Flood-warning archive: every Environment Agency alert and warning raised since 2006, summed per winter FloodRadar, 13 September 2026

Images

Nothing on this page is fetched live. Each figure carries the date its source issued it, and the page is refreshed by hand after NOAA’s monthly discussion.

Be ready before the rain

Save the gauges that matter to you, set a level alert, and let FloodRadar watch the river while you get on with your day.