← Back

TREBROWNBRIDGE

Unknown
• ID: E44973 (formerly SX25F064) • Flow
⚙ The Environment Agency registered this site as SX25F064 until 2 Aug 2026; its history is included on this page.
(24m ago) • 4 readings/hr • 139 views
Current Flow
0.225 m3/s
▬ Steady
24h Max
0.247 m3/s
24h Min
0.204 m3/s
Typical Range
-
Highest Recorded
16.20 m3/s
27 Jan 2026
Since Feb 2025
🚽 Sewage overflows nearby

Recent Flow Readings

🌍 floodradar.co.uk
1 day

Recent Readings

Falling · -1 cm over 6h
20 Sep 07:30 ▼ -0.3 cm 0.225 m3/s
20 Sep 07:15 ▲ +0.3 cm 0.228 m3/s
20 Sep 07:00 ▼ -0.3 cm 0.225 m3/s
20 Sep 06:45 ▼ -0.5 cm 0.228 m3/s
20 Sep 06:30 ▲ +0.2 cm 0.233 m3/s
20 Sep 06:15 ▼ -0.5 cm 0.231 m3/s
20 Sep 06:00 ▲ +0.3 cm 0.236 m3/s
20 Sep 05:45 ▼ -0.3 cm 0.233 m3/s
20 Sep 05:30 ▬ steady 0.236 m3/s
20 Sep 05:15 ▼ -0.9 cm 0.236 m3/s
20 Sep 04:30 ▼ -0.2 cm 0.245 m3/s
20 Sep 04:15 ▬ steady 0.247 m3/s
20 Sep 04:00 ▬ steady 0.247 m3/s
20 Sep 03:30 ▲ +0.5 cm 0.247 m3/s
20 Sep 03:15 ▲ +0.3 cm 0.242 m3/s
20 Sep 03:00 ▬ steady 0.239 m3/s
20 Sep 02:45 ▬ steady 0.239 m3/s
20 Sep 02:30 ▼ -0.3 cm 0.239 m3/s
20 Sep 02:15 ▲ +0.3 cm 0.242 m3/s
20 Sep 02:00 0.239 m3/s

Rainfall & Weather

Loading rainfall and weather data...

Flood history near this gauge

Official Environment Agency warnings issued since 2011 for the 4 flood areas linked to this gauge (nearest 0.2 km away).

35flood warnings 130flood alerts

Most recent flood warning: 2 Feb 2026South Cornwall coast from Gribbin Head to Rame Head

Year by year
YearWarningsAlerts
2026 2 15
2025 4 16
2024 6 22
2023 3 9
2022 0 2
2021 0 3
2020 8 15
2019 3 6
2018 2 10
2017 0 1
2016 3 10
2015 0 4
2014 2 4
2013 0 3
2012 2 6
2011 0 4

Warnings apply to a whole flood area, not necessarily this exact spot. Years before 2006 aren't covered by the EA's historic record.

Nearby Stations

Loading nearby stations...

Station Details

  • Monitoring Station: TREBROWNBRIDGE
  • Watercourse:
  • Nearest reservoir: Siblyback (12.7 km) · 33.0% full (as of 13 Sep 2026)
  • Coordinates: 50°24'38"N 4°23'40"W (50.410438, -4.394536)
  • Open in: Google Maps · Apple Maps (opens your maps app)
  • Status: Active
  • Station Type: Flow gauging station (inferred)
  • Station Reference: E44973
  • Previous references: SX25F064 (to 2 Aug 2026)
  • Also at this site: Trebrownbridge (49132, level, reporting)
  • EA Gauge ID: E44973-flow-water-i-15_min-m3_s
  • Parameter: Flow
  • Unit: m3/s
  • Typical rise rate: 8 cm/hr (p95 sustained over 90 days)
  • Typical data delay: ~22 min (measured reading→publication lag)
  • Tidal: No
  • Lock / structure: No
  • Drainage Area: 39 km² upstream of this gauge
  • Flow Archive: National River Flow Archive ↗

Geographic coordinates may reflect the access point for the gauge, and not the precise location in the watercourse that it is taking readings from.

Catchment Character

🌊 Mixed response A balance of quick runoff and slower groundwater baseflow.

Your catchment is all the land that drains rainfall into the river above this gauge. Its character — how steep, wet, wooded, urban or chalky that land is — decides how fast rain here turns into a rising river. A steep, bare or clay catchment is “flashy” (rises and falls quickly, floods easily); a flat, chalk or well-wooded one is slow and steady. The tiles below put numbers to that; the flow-duration curve reads left-to-right from the river’s typical high flows (Q5) down to its low flows (Q95) — a steep curve means a flashy river.

The physical character of the land that drains to this gauge, and how it shapes its flood response — from the National River Flow Archive (UKCEH).
Baseflow Index
0.59
mixed response
Avg Annual Rainfall
1,410 mm/yr
1991–2020 · +1% since 1941–70
Urban Extent
1.7%
largely rural
Median Annual Flood
7.39 m³/s
QMED — typical yearly peak flow
Highest Daily Mean Flow
13.20 m³/s
22 Dec 2012 · daily mean, not the instantaneous peak
Flow-Duration Curve
mean 1.083.010.7500.2275% (high)% of days exceeded95% (low)
Daily flow (m³/s) exceeded each % of the time — a steep curve is flashy, a flat one is steady. Q5 high · Q50 median · Q95 low.
Land Cover (2023)
Woodland 7%Grassland 66%Arable 19%Urban 7%
Grassland 74% → 66% since 1990

Flow affected by: groundwater abstraction, industrial / agricultural abstraction.

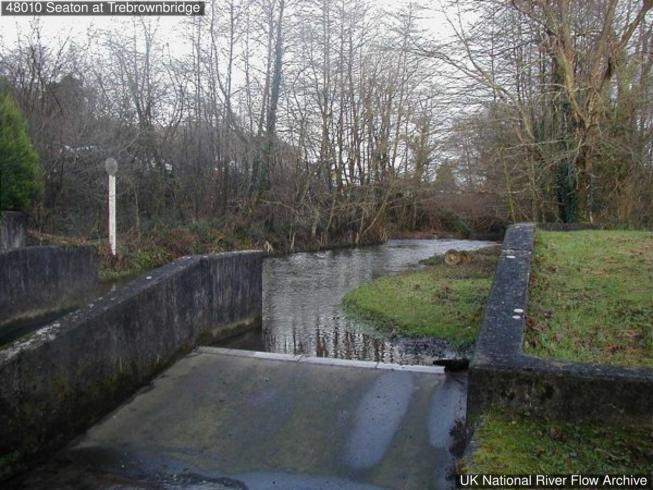
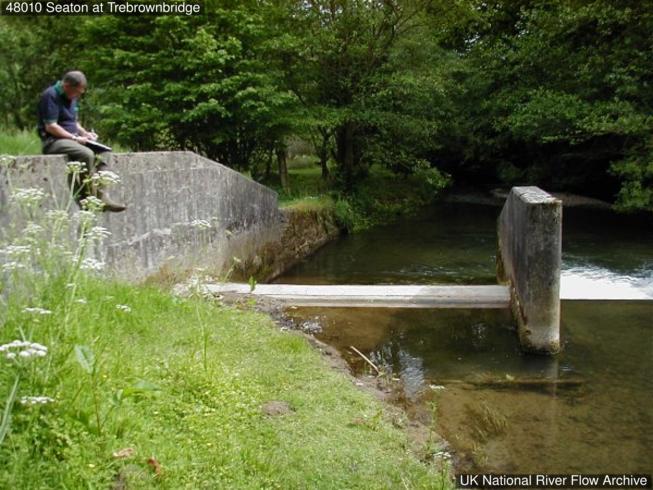
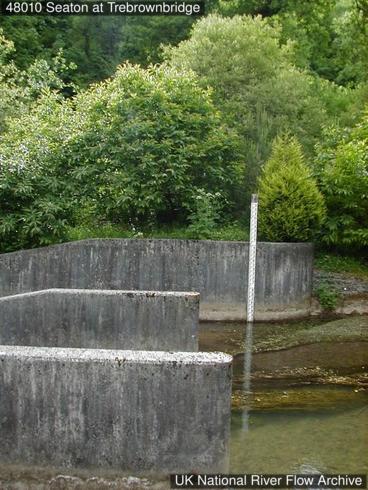
Photos

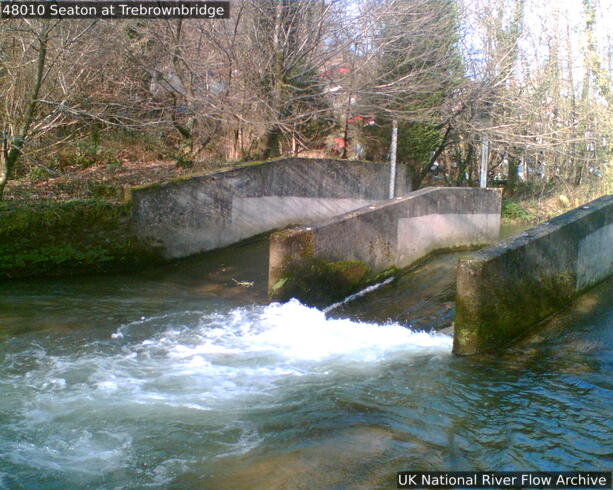
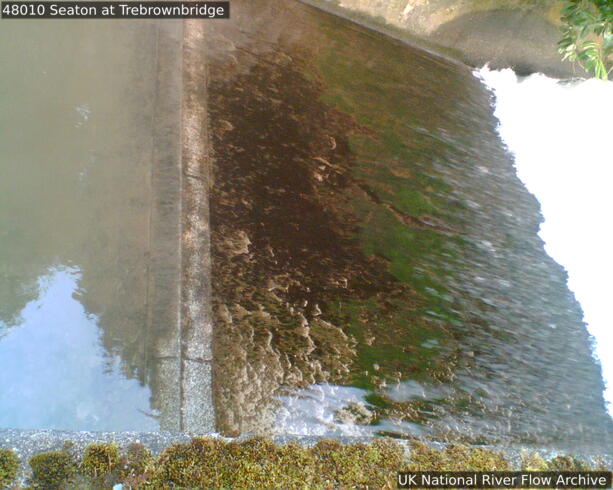
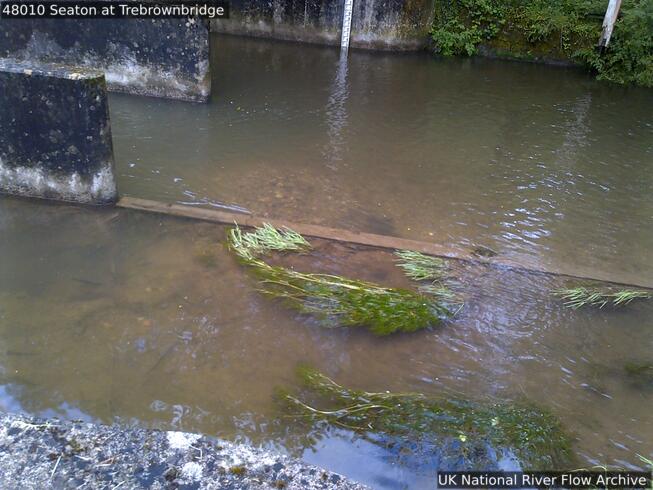
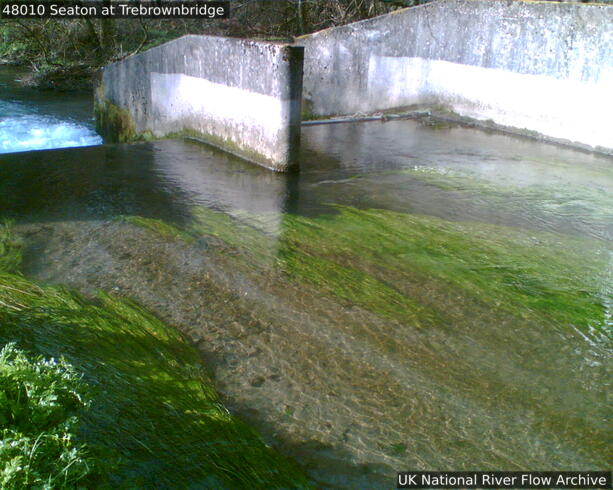
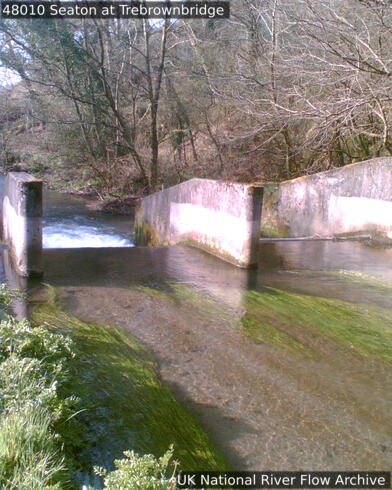
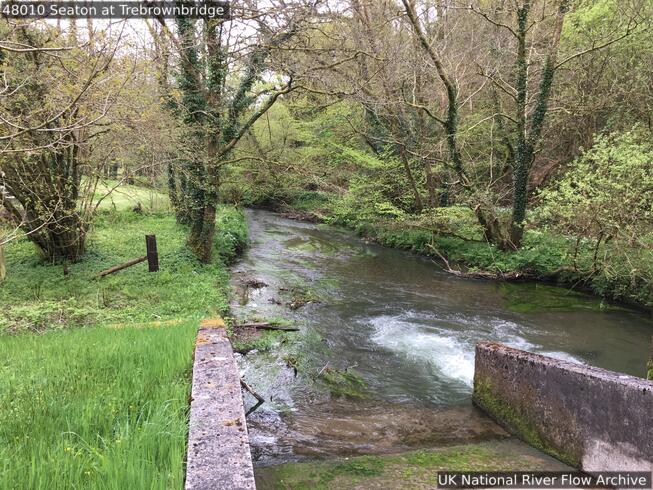
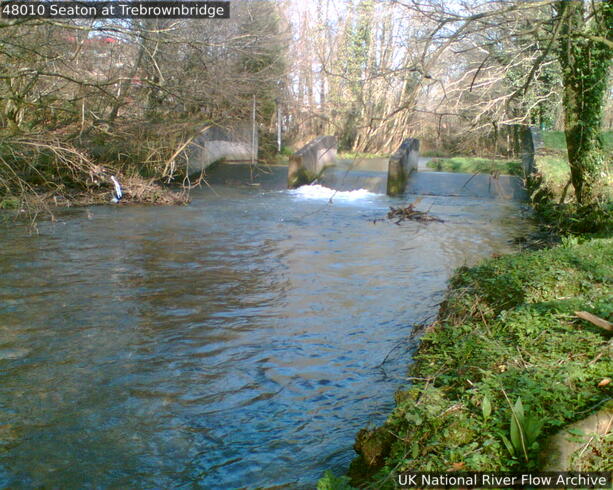
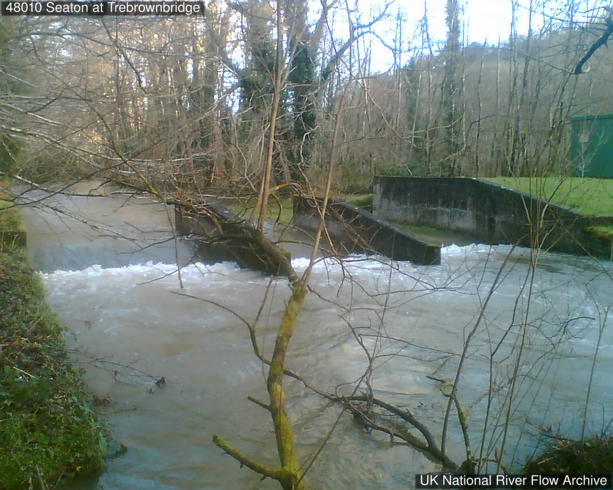
Gauging-station photographs from the National River Flow Archive (UKCEH).

Photos © NRFA / UKCEH & the measuring authority — shown at web resolution. Full gallery on the NRFA ↗

About this gauge

Three-bay compound Crump profile weir with minimal artificial interference with natural flow regime.

More detail

The catchment

Rises on the Caradon Hill granites. Elongated, linear catchment springing from southernmost outcrop of Bodmin Granite. Great bulk of the catchment on Devonian slates and shales interspersed with tuffs and lavas. Moderate relief. Land use is low-grade agriculture, grazing and some afforestation. No major changes to catchment.

The station

Three-bay compound Crump profile weir, middle crest length 3m and side crests 4m each (total 11m). Wing walls and floodbanks at 2.05m.

How it measures flow

Thought to be fully modular but evidence suggests that in 2012 when twice, the peak level reached more than 1m stage, the weir may have drowned. This is still to be confirmed. Upstream subject to significant siltation/sedimentation. Weed growth problems. Two peak flow ratings applied across period of record.

Flow regime

Natural to within 10% at Q95, minimal interference with natural flow regime.

The flow record

Peak flows rejected 1971-2006 as stilling well issues causing significant under-recording of peak river levels. Full period of record peak flow data reviewed and released in September 2023 (WINFAP Files v12).

Descriptions from the National River Flow Archive (UKCEH). NRFA station record ↗

Gauge Details

How this gauging station is built and how long it has measured (NRFA / UKCEH).

Gauge type
Gauging structure
Operating since
1972
Station datum
26.6 mAOD
Flow record
1957–2024 · 67 yrs · 84% complete
Peak-flow record
since 1972
Hydrometric area
48
Measured by
Environment Agency

Frequently asked questions

Is TREBROWNBRIDGE flooding today?

The latest recorded level is 0.23m. Compare it with the recent history on the chart above to judge whether levels are unusually high.

Is the river level rising or falling at TREBROWNBRIDGE?

Based on the most recent readings, the level is currently steady. The chart above shows the last 12 hours of measurements by default (up to 7 days), updated roughly every 15 minutes.

How often is this river level data updated?

Readings are supplied by the Environment Agency gauge. FloodRadar checks for updates roughly every 15 minutes; the timestamp above shows how recent the latest available reading is.

Embed this gauge on your website

Free live river-level widget — ideal for parish councils, angling clubs and local sites. Updates automatically.

Preview

📮 Flood risk by postcode near this gauge

Postcodes within 5 km with properties in the Environment Agency’s rivers-and-sea flood-risk bands:

Check any UK postcode’s flood risk →

🏠 Buying or renting around here? Get the Property Flood-Risk Report for any English postcode — official risk band, recorded floods, warning history, river behaviour and nearby storm overflows. £19 one-off. Learn more →