Geographic coordinates may reflect the access point for the gauge, and not the precise location in the watercourse that it is taking readings from.
Catchment Character
🌊 Fairly flashyResponds fairly quickly to rain, with moderate baseflow between events.
Your catchment is all the land that drains rainfall into the river above this gauge. Its character — how
steep, wet, wooded, urban or chalky that land is — decides how fast rain here turns into a rising river. A steep, bare or clay
catchment is “flashy” (rises and falls quickly, floods easily); a flat, chalk or well-wooded one is
slow and steady. The tiles below put numbers to that; the flow-duration curve reads left-to-right
from the river’s typical high flows (Q5) down to its low flows (Q95) — a steep curve means a flashy river.
The physical character of the land that drains to this gauge, and how it shapes its flood response — from the National River Flow Archive (UKCEH).
Baseflow Index
0.48
mixed response
Avg Annual Rainfall
1,797 mm/yr
1991–2020 · +13% since 1941–70
Urban Extent
0.7%
largely rural
Median Annual Flood
47.87 m³/s
QMED — typical yearly peak flow
Highest Daily Mean Flow
56.50 m³/s
27 Dec 1979 · daily mean, not the instantaneous peak
Flow-Duration Curve
Daily flow (m³/s) exceeded each % of the time — a steep curve is flashy, a flat one is steady. Q5 high · Q50 median · Q95 low.
The headwaters of Plym and Meavy rise on W Dartmoor granite downstream of Burrator Reservoir and pass SW onto Upper Devonian slates. Insignificant areas of alluvium and river gravel exist, most particularly between the gauging station and the Meavy-Plym confluence. Moorland catchment with forestry. No major changes apart from afforestation.
The station
Compound crump weir built in 1971. Centre crest of 3.5m and 2 flank crests of 4.5m. Total crest width 12.5m.
How it measures flow
Modular to around 1.6m, drowning occurs at high flows. One peak flow rating across period of record. Theoretical rating does not apply beyond top of wingwalls are they are very rarely overtopped and by very little. Only bypassed on largest floods of 1979 and 2000. Tailwater recorder added 09/2007. At one time received diversions from the Dart via the Devonport Leat (~0.21 cumec), but this has now ceased. Flows from 2000 (reopening) onward reprocessed in 2007 following datum correction. Rating appears to underestimate flows beyond 0.8m. An Acoustic Doppler device installed in 09/2014 to confirm flows above 0.8m and identify the point and extent of drowning.
Flow regime
Burrator Reservoir influences flows. The headwaters of Plym and Meavy rise on W Dartmoor granite and pass SW onto Upper Devonian slates. Insignificant areas of alluvium and river gravel exist, particularly between gauging station and Meavy-Plym confluence. Land use is moorland, forestry.
The flow record
Station closed between 01/10/1981-17/04/2000. Full period of record peak flow data reviewed and released in September 2020 (WINFAP Files v9).
How this gauging station is built and how long it has measured (NRFA / UKCEH).
Gauge type
Gauging structure
Operating since
1971
Station datum
15.5 mAOD
Flow record
1971–2024 · 53 yrs · 65% complete
Peak-flow record
since 1971
Hydrometric area
47
Measured by
Environment Agency
Nearby Groundwater
Soil Moisture
💧 Storm overflows on this river
Frequently asked questions
Is CARNWOOD flooding today?
The latest recorded level is 0.62m. Compare it with the recent history on the chart above to judge whether levels are unusually high.
Is the river level rising or falling at CARNWOOD?
Based on the most recent readings, the level is currently steady. The chart above shows the last 12 hours of measurements by default (up to 7 days), updated roughly every 15 minutes.
How often is this river level data updated?
Readings are supplied by the Environment Agency gauge. FloodRadar checks for updates roughly every 15 minutes; the timestamp above shows how recent the latest available reading is.
Embed this gauge on your website
Free live river-level widget — ideal for parish councils, angling clubs and local sites. Updates automatically.
Preview
📮 Flood risk by postcode near this gauge
Postcodes within 5 km with properties in the Environment Agency’s rivers-and-sea flood-risk bands:
 FloodRadar
Log inCreate free account
FloodRadar
Log inCreate free account
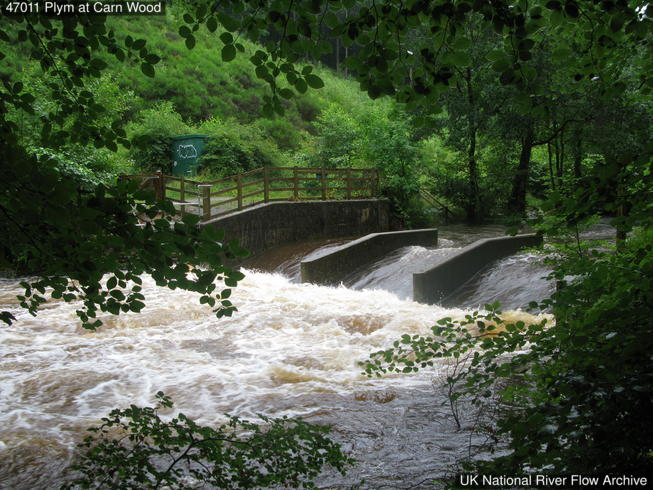 29 Jul 2009 Carnwood high flow on 29 July 2009 @ 1710GMT looking US to weir. SG = 1.064m, Q = 20.1 cumecs
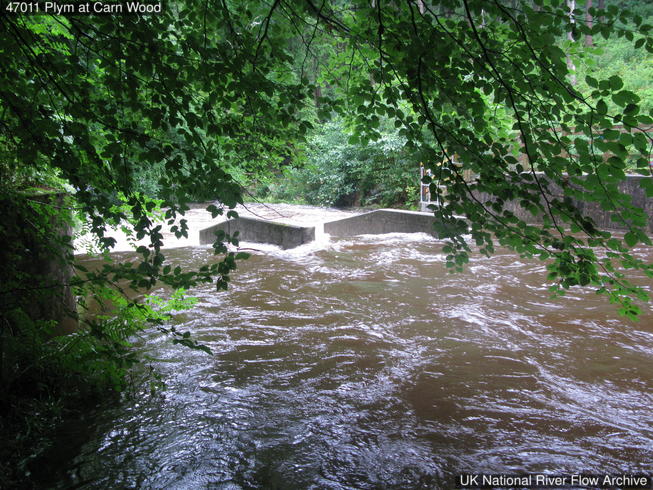 29 Jul 2009 High flow looking downstream to weir, stage = 1.064m
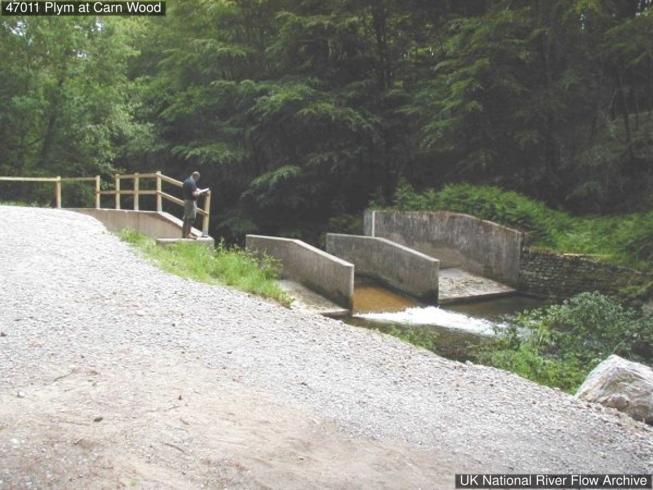
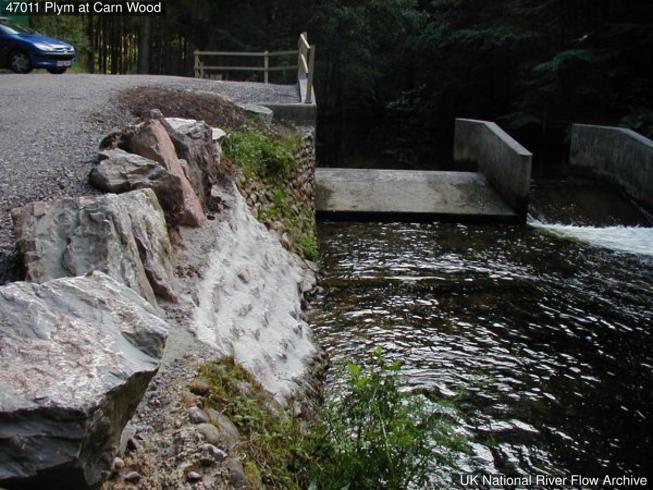
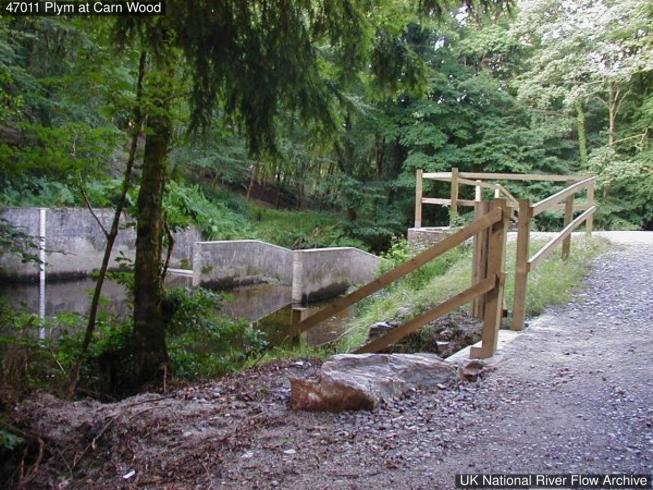
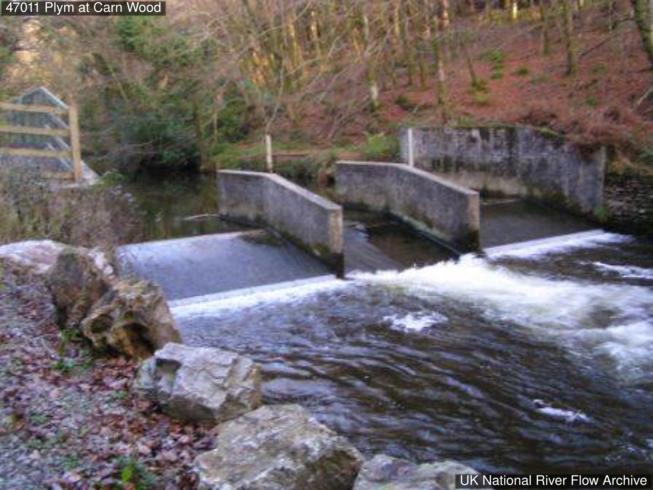 Looking upstream towards the weir