SSEN
35,939
customer interruptions on 19 September
Busiest hour: 12:00 to 13:00 on 19 September (UK time), when 7,926 customer interruptions began.
A usual day about 3,800
About 32,000 more than on a usual day
 FloodRadar
Log inCreate free account
19 September 2018 · 2018-19 season · named by Met Eireann · Scotland, Ireland, Northern Ireland
Did this storm flood you? Log it
This storm's nations lie outside England, and the only record counted here is the Environment Agency's, which covers England. Welsh warnings are held in a separate record and are not counted here, and FloodRadar only began recording Scottish warnings on 16 September 2026 because SEPA publishes no archive. A zero is the reach of the record, not a storm that flooded nothing.
19 September 2018
35,939
customer interruptions on 19 September
Busiest hour: 12:00 to 13:00 on 19 September (UK time), when 7,926 customer interruptions began.
A usual day about 3,800
About 32,000 more than on a usual day
32,945
customer interruptions on 19 September
Busiest hour: 12:00 to 13:00 on 19 September (UK time), when 11,101 customer interruptions began.
A usual day about 1,600
About 31,000 more than on a usual day
Each drawing: customers whose power cut began, hour by hour (UK time); each on its own scale.
Records available for 2 of 7 networks · no UK total
Homes and businesses; repeat interruptions count again. Includes all causes across each network, not just the storm.
Not recorded for these dates: UK Power Networks, Northern Powergrid, National Grid, NIE Networks, SP Energy Networks.
Customers: each network's own record of the power cuts that began on each day (UK time), every unplanned power cut of three minutes or more, counted in the customers (homes and businesses) it cut off. A home or business cut off twice counts twice. Each figure counts every power cut across the network's whole area on these days, whatever the cause; it does not mean the storm caused them all. A usual day is the middle of the network's daily figures for September in the years around 2018 that it has recorded (five years either side), leaving out the days of every storm FloodRadar lists and any day its record marks as thin or still provisional. "More than on a usual day" is the storm's figure less the usual day, rounded to two figures, as the usual day is ("no more" when it is not clearly above it): an estimate of what the storm added, not a count of the power cuts it caused. No UK total is given, because not every network is recorded for these dates.
About the drawings: each network's record gives the minute each power cut began but no usable end time, so a drawing shows the customers whose power cut began in each hour (UK time), not how many were off at once. The line passes through each hour's figure and never rises above the higher of two neighbouring hours between them; each drawing has its own scale.
Worked out by GetMyPropertyReport from the networks' own data. SSEN Distribution: NaFIRS SHEPD Faults (https://data.ssen.co.uk/
Where the licences are published: Creative Commons Attribution 4.0: https://creativecommons.org/
| Gauge | Total mm |
|---|---|
| Aberllefenni, Cymerau Farm · Powys North · Met Office | 135.8 |
| Aldon · Shropshire | 121.0 |
| Treherbert, Tyn-Y-Waun · Mid Glamorgan · Met Office | 118.8 |
| Llanerch-Yrfa · Powys South · Met Office | 116.6 |
| Trecastle, Portis W Wks · Powys South · Met Office | 115.9 |
| Nant-Yr-Ysfa · Mid Glamorgan · Met Office | 108.4 |
| Loch Restil · Argyll and Bute | 106.8 |
| Maerdy W Wks · Mid Glamorgan · Met Office | 104.4 |
| Cluanie Inn · Highland | 104.0 |
| Machynlleth · Powys North · Met Office · includes 1 estimated day | 102.3 |
| Rest and be Thankful · Argyll and Bute | 101.4 |
| Llandovery P Sta · Dyfed · Met Office | 101.4 |
Met Office gauges: days from 09:00 to 09:00, the same dates.
Met Office (2026): MIDAS Open: UK daily rainfall data, v202607. NERC EDS Centre for Environmental Data Analysis. Open Government Licence v3.
| Station | Peak | % of warning |
|---|---|---|
| Clifton Hall · River Mease · Very high | 5.17 m | 349% |
| Marshfield Bridge · Valley Brook · Very high | 1.57 m | 285% |
| Wakefield Brooks Bank · Balne Beck · High for this river | 0.88 m | 274% |
| Whitewater Bridge · River Maun · Very high | 2.13 m | 266% |
| Chandler's Ford · Monks Brook · Very high | 2.56 m | 246% |
| Arle · River Chelt · Very high | 1.61 m | 244% |
| Upper Tean · River Tean · Above typical high | 0.96 m | 239% |
| Davis Road · River Birket · Very high | 2.83 m | 238% |
| Ilam · River Manifold · Above typical high | 1.21 m | 231% |
| Calthorpe Park · River Rea · Above typical high | 0.93 m | 225% |
| Bescot · River Tame · High for this river | 2.69 m | 216% |
| Shifnal · Wesley Brook · High for this river | 0.50 m | 210% |
Gauge records cover 18–20 September 2018 (the storm window ± a day). Frozen 19 Nov 2026.
Photos: Vauxford (CC BY-SA 4.0); Des Colhoun (CC BY-SA 2.0), via Wikimedia Commons. Satellite picture: NASA Worldview, public domain.
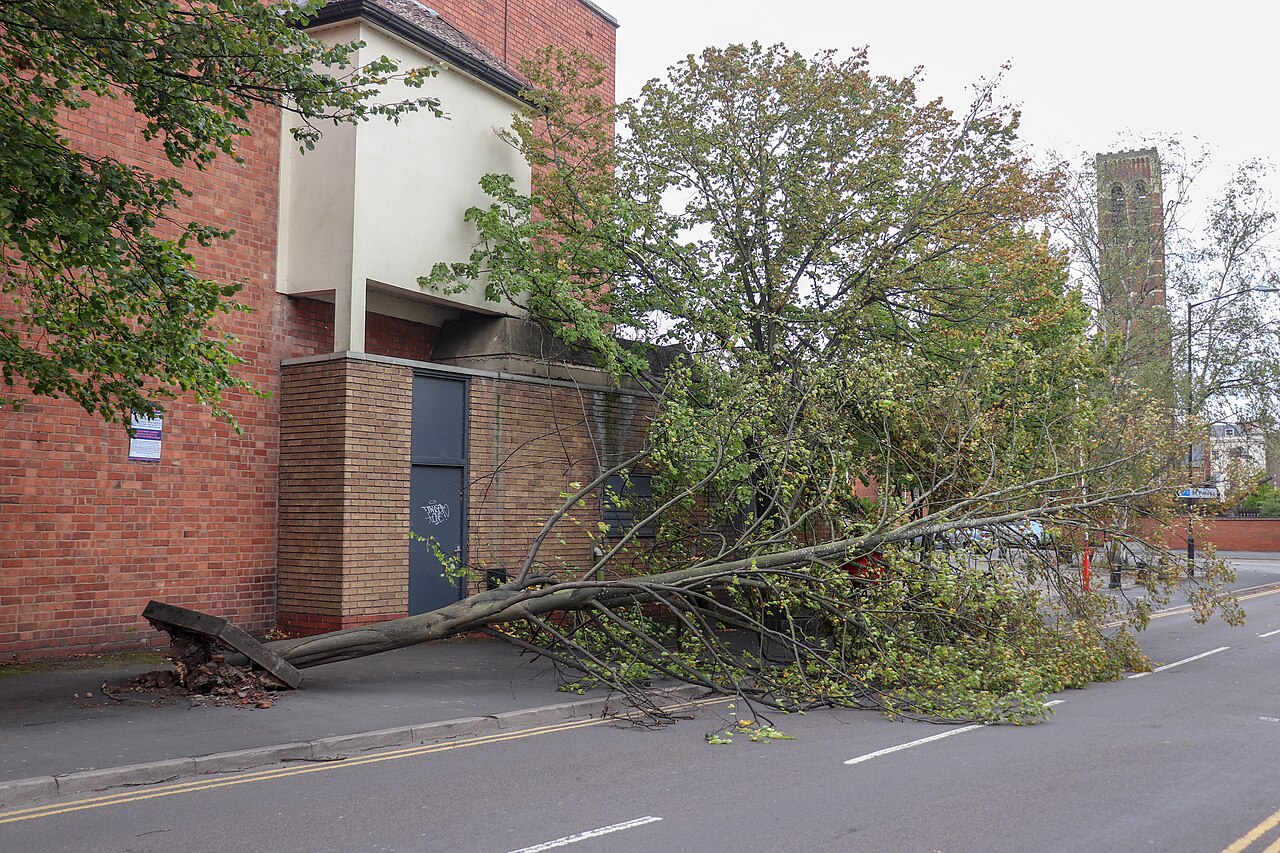
Dormer Place, Leamington. File title: Fallen Tree in Dormer Place, Leamington Spa.jpg. Photo: Vauxford. Licence: CC BY-SA 4.0. Held at Wikimedia Commons: https://commons.wikimedia.org/
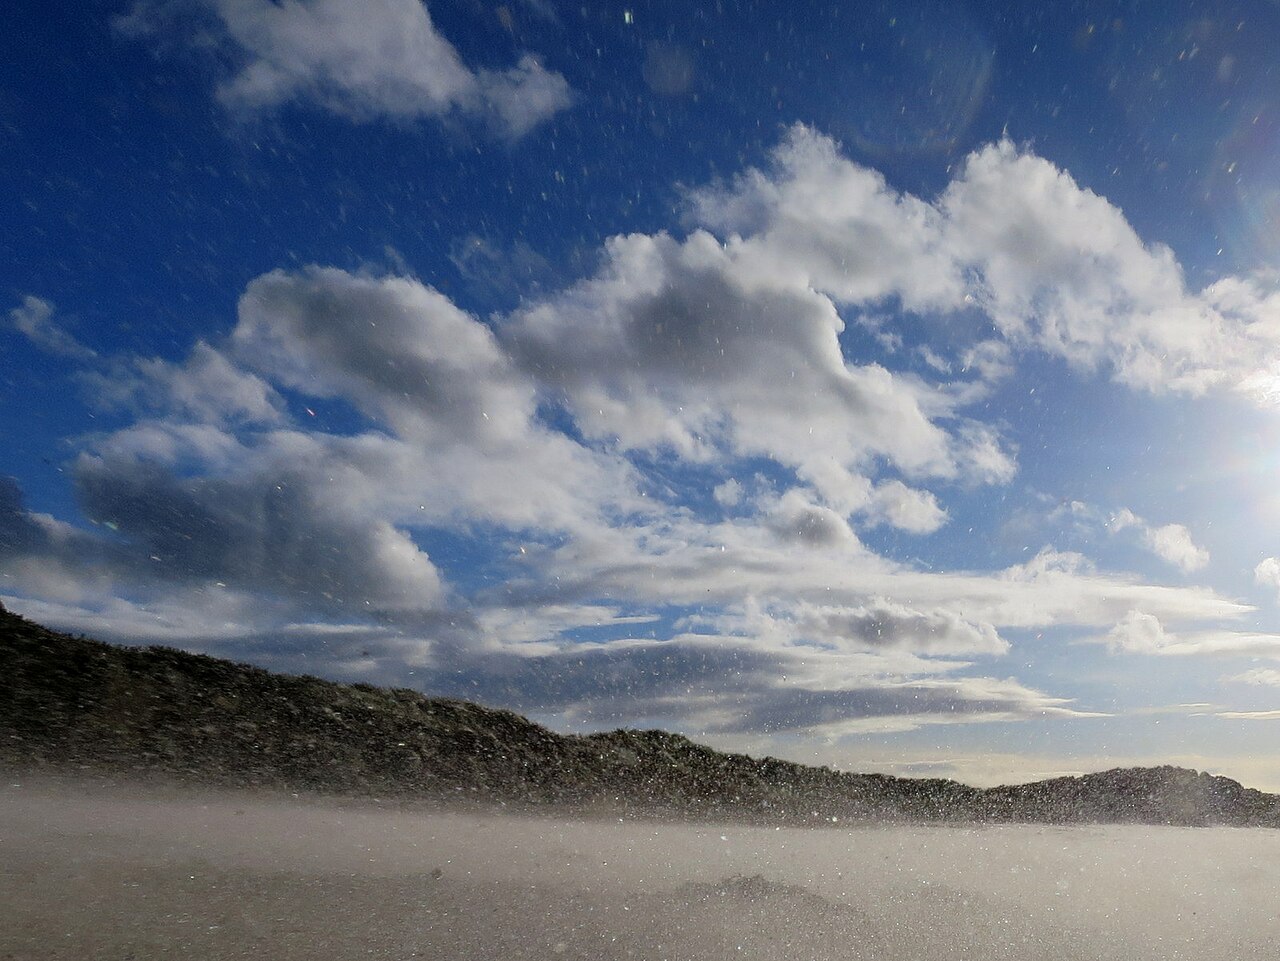
West Beach, Lossiemouth. File title: Sand Storm on West Beach - geograph.org.uk - 5911938.jpg. Photo: Des Colhoun. Licence: CC BY-SA 2.0. Held at Wikimedia Commons: https://commons.wikimedia.org/
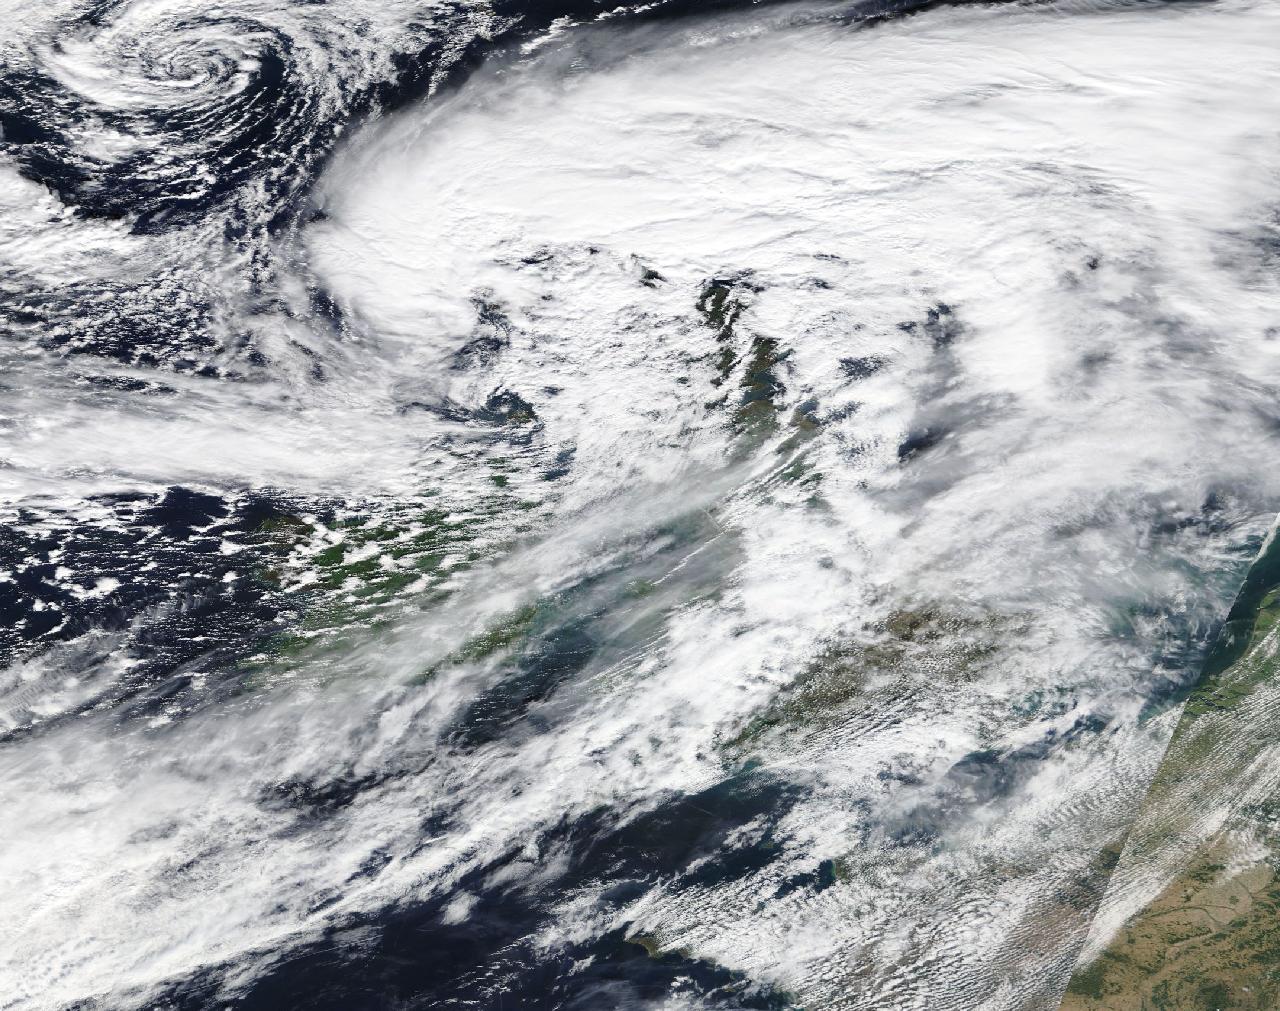
Satellite view. Image: NASA Worldview, 19 September 2018. NASA imagery is in the public domain. Address: https://wvs.earthdata.nasa.gov/
Where the licences are published: Creative Commons Attribution-ShareAlike 4.0 (CC BY-SA 4.0): https://creativecommons.org/
Each picture is shown smaller and cropped to fit its frame; nothing else about it is changed. The date and place of each photo are from its own record at Wikimedia Commons.
A tree brought down by Storm Ali's winds across the pavement and into Dormer Place, Leamington Spa, Warwickshire. 19 September 2018.
Photo: Vauxford, CC BY-SA 4.0
Wind-blown sand over West Beach, Lossiemouth, Moray. 19 September 2018.
Photo: Des Colhoun, CC BY-SA 2.0
Satellite view over the British Isles on 19 September 2018.
Image: NASA Worldview, public domain
FloodRadar compiles Environment Agency warning history, gauge data and public reporting. It is not an emergency service and does not replace official flood warnings — always follow official guidance during a storm.
FloodRadar helper · beta