← Back
0.07

Ilam

Manifold
Dove catchment • Ilam • Staffordshire • ID: 4031 • Level
(36m ago) • 4 readings/hr • 163 views

Set water level alerts

Get notified about Ilam — tick as many as you like, they all share the notify settings below.

⤴ Unusual rise — FloodRadar+Top 1% rise rate for this gauge.
Drag the line on the chart, or type a value: mASD
Quick pick:

Each one is saved as its own alert — pause or remove them individually any time.

Not an emergency service — if in danger call 999. Alerts rely on EA/SEPA/NRW data and are best-efforts. Terms

Current Level
0.074 mASD
▬ Steady
24h Max
0.075 mASD
24h Min
0.069 mASD
Typical Range
0.10 - 0.52
mASD
Highest Recorded
2.81 mASD
EA official record
1.77 in our data (since Apr 1968)
Current level is 3% of this
🚽 Sewage overflows nearby

Recent Water Levels

🌍 floodradar.co.uk
1 day

Recent Readings

Steady over 6h
08 Oct 02:45 ▬ steady 0.074 mASD
08 Oct 02:30 ▬ steady 0.074 mASD
08 Oct 02:15 ▬ steady 0.074 mASD
08 Oct 02:00 ▬ steady 0.074 mASD
08 Oct 01:30 ▬ steady 0.074 mASD
08 Oct 01:15 ▬ steady 0.074 mASD
08 Oct 01:00 ▬ steady 0.074 mASD
08 Oct 00:45 ▬ steady 0.074 mASD
08 Oct 00:30 ▬ steady 0.074 mASD
08 Oct 00:15 ▬ steady 0.074 mASD
07 Oct 23:45 ▬ steady 0.074 mASD
07 Oct 23:30 ▬ steady 0.074 mASD
07 Oct 22:30 ▬ steady 0.074 mASD
07 Oct 22:15 ▬ steady 0.074 mASD
07 Oct 22:00 ▬ steady 0.074 mASD
07 Oct 21:45 ▬ steady 0.074 mASD
07 Oct 21:30 ▬ steady 0.074 mASD
07 Oct 21:15 ▬ steady 0.074 mASD
07 Oct 21:00 ▬ steady 0.074 mASD
07 Oct 20:30 0.074 mASD

Station Details

  • Monitoring Station: Ilam
  • Watercourse: River Manifold
  • Nearest Town: Ilam
  • County: Staffordshire
  • Nearest reservoir: Carsington (10.9 km) · 63.7% full (as of 5 Oct 2026)
  • Coordinates: 53°3'12"N 1°47'35"W (53.053456, -1.793028)
  • Open in: Google Maps · Apple Maps (opens your maps app)
  • Date Opened: 9 Apr 1968
  • Status: Active
  • Station Type: River level station
Technical details: references, datum, range, flow archive
  • Station Reference: 4031
  • RLOI id: 2113 (the EA's check-for-flooding station id)
  • EA Gauge ID: 4031-level-stage-i-15_min-mASD
  • Parameter: Level
  • Unit: mASD
  • Typical rise rate: 1 cm/hr (p95 sustained over 90 days)
  • Typical data delay: ~22 min (measured reading→publication lag)
  • Tidal: No
  • Lock / structure: No
  • Catchment Area: Dove
  • Typical Range: 0.095 – 0.524 mASD
  • Drainage Area: 149 km² upstream of this gauge
  • Flow Data: Daily mean flow (m³/s) to 6 Oct (2 days behind — the EA publishes each day's mean a day or two after it ends; unchecked, provisional) via EA Hydrology
  • EA Cross-check: 0.07 mASD (EA at 8 Oct 02:45)
  • Flow Archive: National River Flow Archive ↗

Geographic coordinates may reflect the access point for the gauge, and not the precise location in the watercourse that it is taking readings from.

Nearby Stations

Gauges connected to this river, and others nearby. A distance “by river” follows the river on the map; any other is in a straight line.

Connected upstream

Connected downstream

Same river system, separate branch

Distances by river: OS Open Rivers. Contains OS data © Crown copyright and database rights 2026.

💧 Storm overflows upstream of this gauge

Storm overflows whose water reaches this gauge on the mapped river network, nearest first by distance along the river. The status is each water company's monitor: it says whether an overflow is discharging, not how much or what it contains.

3 storm overflows are traced upstream of this gauge, the nearest 14.1 km away along the river. 0 report discharging now, 3 report not discharging.

💧
Severn Trent Water · into River Hamps · 14.1 km upstream along the river
0 spills · 0 hours in 2025
Not discharging now
💧
Severn Trent Water · into Warslow Brook · 14.5 km upstream along the river
152 spills · 2,007 hours in 2025
Not discharging now · last
💧
Severn Trent Water · into River Hamps · 18.6 km upstream along the river
25 spills · 330 hours in 2025
Not discharging now · last

Nearby, connection not known

Within 6 km in a straight line, but the river map cannot say whether their water passes this gauge.

💧
Severn Trent Water · into Thorpe Brook (River Dove) · 1.9 km away in a straight line · no mapped watercourse close enough to be sure
19 spills · 108 hours in 2025
Not discharging now · last
💧
Severn Trent Water · into Groundwater · 4.6 km away in a straight line · discharges to ground
19 spills · 137 hours in 2025
Not discharging now · last
💧
Severn Trent Water · into Henmore/Scow Brook · 5.7 km away in a straight line · no mapped watercourse close enough to be sure
0 spills · 0 hours in 2025
Not discharging now
💧
Severn Trent Water · into Unnamed Ditch Draining To Henmore Brook · 6.0 km away in a straight line · no mapped watercourse close enough to be sure
15 spills · 160 hours in 2025
Not discharging now · last
💧
Severn Trent Water · into Tributary Of Henmore Brook · 6.0 km away in a straight line · no mapped watercourse close enough to be sure
27 spills · 167 hours in 2025
Not discharging now · last

6 other overflows within 6 km are downstream of this gauge or on another branch of the river network, so they are not listed.

These are the water companies' monitor statuses; a spill does not by itself explain a change in the gauge level. River connections and distances are traced on OS Open Rivers (edition 2026-04), which leaves out many small channels. Explore the sewage map →

Contains OS data © Crown copyright and database rights 2026.

Rainfall & Weather

Loading rainfall and weather data...

How often this river runs high

In a typical year this gauge reaches its typical high of 0.52 m on about 44 days. This year so far: 27 days.

2026 27 days, 2 of them high · 2 high so far
2025 39 days, 3 of them high · 3 high
2024 50 days, 6 of them high · 6 high
2023 53 days, 7 of them high · 7 high
2022 30 days, 2 of them high · 2 high
2021 49 days, 6 of them high · 6 high
2020 46 days, 9 of them high · 9 high
2019 55 days, 7 of them high · 7 high
2018 41 days, 2 of them high · 2 high
2017 29 days, 2 of them high · 2 high

Counted from each day's highest reading. Days with missing or implausible readings are left out. The darker part is days above 1.19 m, the level this gauge tops only a few days a year.

Flood history near this gauge

Official Environment Agency warnings issued since 2006 for the 7 flood areas linked to this gauge (nearest 1.3 km away).

27flood warnings 161flood alerts

Most recent flood warning: 27 Aug 2026 — Henmore Brook at Ashbourne

Year by year
YearWarningsAlerts
2026 4 11
2025 0 14
2024 6 20
2023 5 13
2022 1 7
2021 0 6
2020 6 9
2019 1 14
2018 0 6
2017 0 3
2016 2 7
2015 0 6
2014 0 2
2013 0 7
2012 1 14
2011 0 2
2010 0 3
2009 0 2
2008 1 9
2007 0 5
2006 0 1

Warnings apply to a whole flood area, not necessarily this exact spot. Years before 2006 aren't covered by the EA's historic record. See also the Ilam flood history.

Flood areas linked to this gauge

Flood warnings and alerts are issued for whole areas. These are the 7 areas linked to this gauge, nearest first.

Catchment Character

🌊 Fairly flashy Responds fairly quickly to rain, with moderate baseflow between events.

Your catchment is all the land that drains rainfall into the river above this gauge. Its character — how steep, wet, wooded, urban or chalky that land is — decides how fast rain here turns into a rising river. A steep, bare or clay catchment is “flashy” (rises and falls quickly, floods easily); a flat, chalk or well-wooded one is slow and steady. The tiles below put numbers to that; the flow-duration curve reads left-to-right from the river’s typical high flows (Q5) down to its low flows (Q95) — a steep curve means a flashy river.

The physical character of the land that drains to this gauge, and how it shapes its flood response — from the National River Flow Archive (UKCEH).
Baseflow Index
0.46
mixed response
Avg Annual Rainfall
1,139 mm/yr
1991–2020 · +5% since 1941–70
Urban Extent
0.3%
largely rural
Median Annual Flood
66.93 m³/s
QMED — typical yearly peak flow
Highest Daily Mean Flow
91.00 m³/s
21 Dec 1991 · daily mean, not the instantaneous peak
Flow-Duration Curve
mean 3.6511.482.360.6365% (high)% of days exceeded95% (low)
Daily flow (m³/s) exceeded each % of the time — a steep curve is flashy, a flat one is steady. Q5 high · Q50 median · Q95 low.
Land Cover (2023)
Woodland 3%Grassland 89%Heath/scrub 5%Urban 1%Other 1%

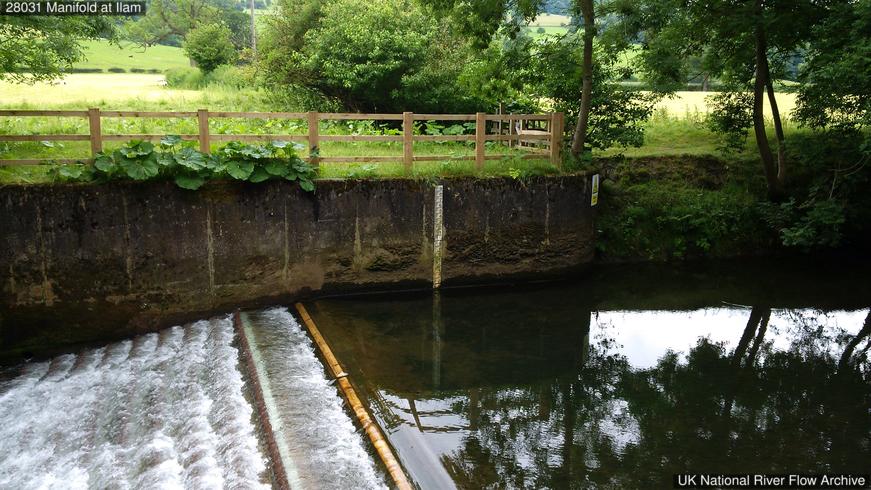
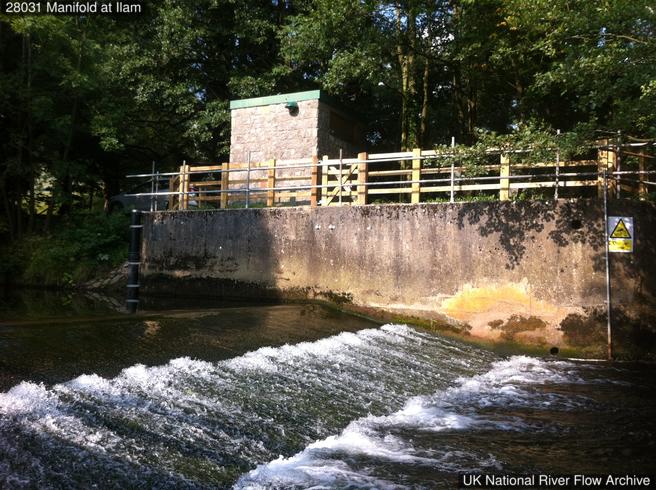
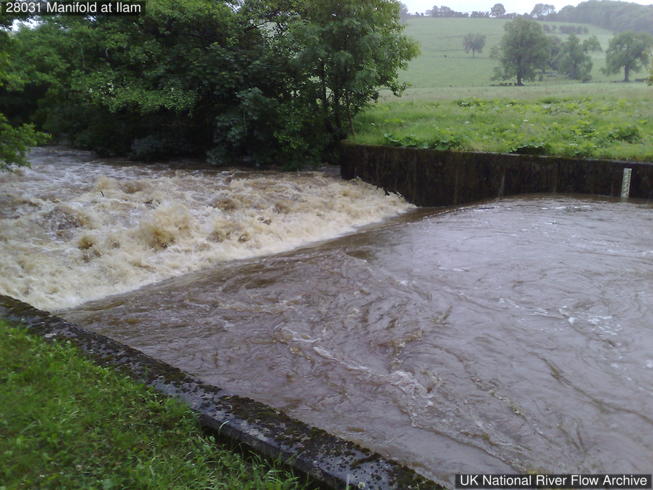
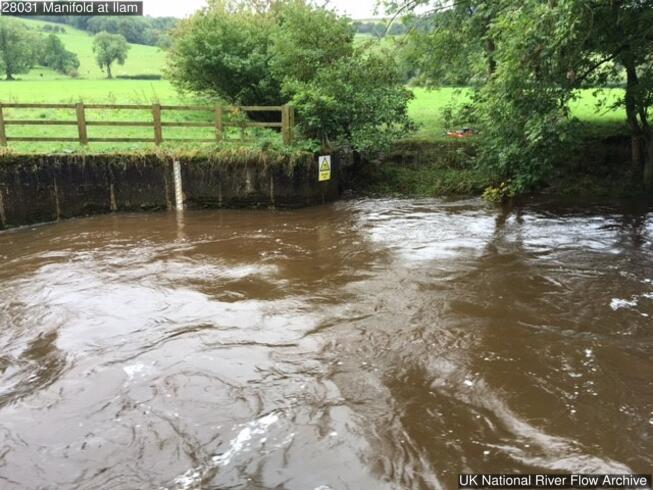
Photos

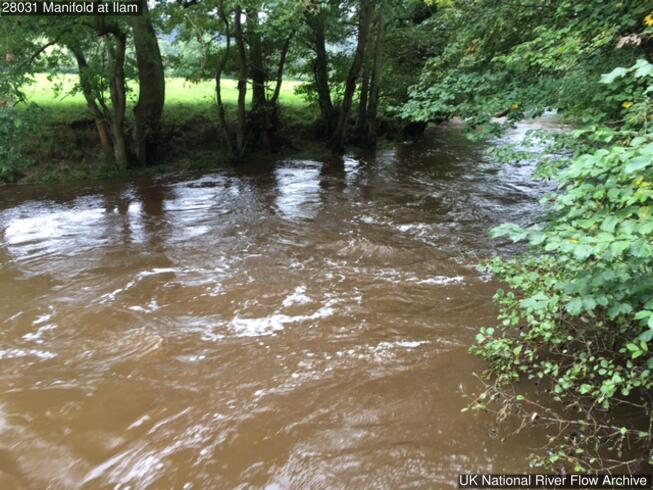
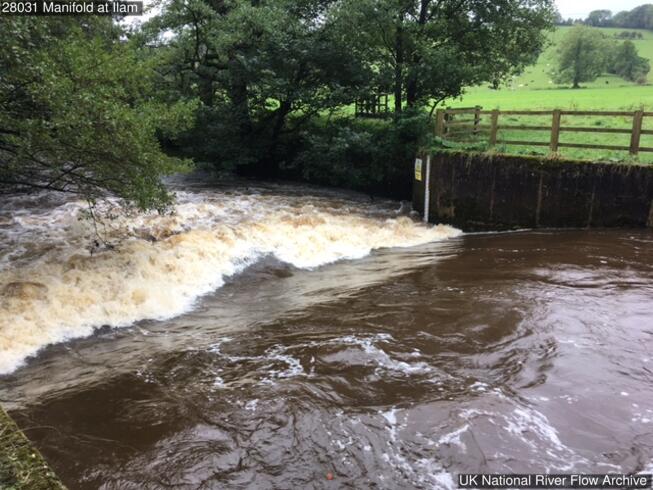
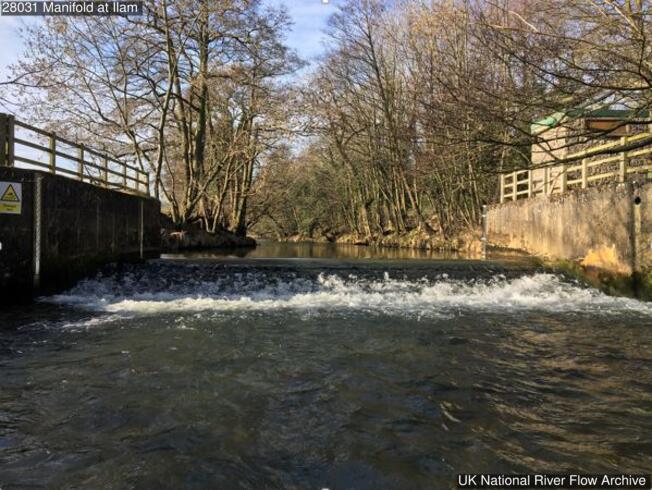
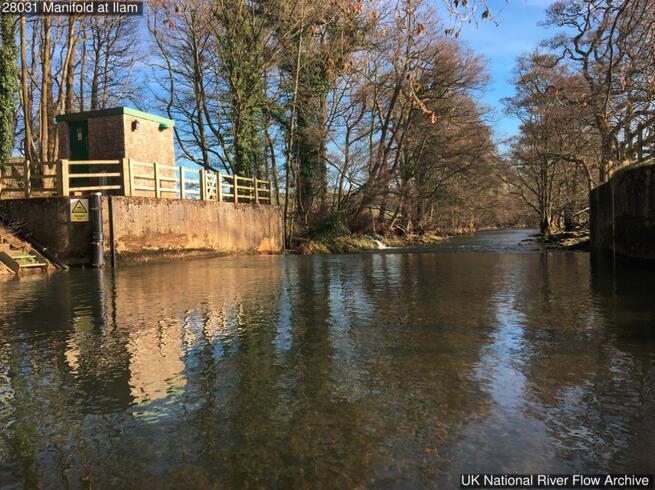
Gauging-station photographs from the National River Flow Archive (UKCEH).

Photos © NRFA / UKCEH & the measuring authority — shown at web resolution. Full gallery on the NRFA ↗

About this gauge

Crump profile weir somewhat insensitive but good quality data throughout the range of flows but difficult to gauge at higher flows.

More detail

The catchment

Headwaters of moderate relief and drain sandstone and mudstone of the Millstone Grit; middle reach has cut deep gorges through Carboniferous Limestone. Responsive catchment. Sheep grazing and moorland.

The station

Crump profile weir, 12.5m wide in a straight reach - modular to bankfull. Rocky bed, somewhat insensitive but good quality data throughout the range. Gaugings possible with ADCP just upstream of weir at levels up to around 0.8m after which it becomes increasingly more difficult due to turbulent flow. Gaugings can also be performed in Ilam village however are not always reliable. Located downstream of Ilam town and 700m upstream of Manifold/Dove confluence. Fish baffles and eel pass installed on weir in July 2015. Modular style eel bristles added to right bank side of weir, on downstream face in July 2024.

How it measures flow

One rating applied across period of record. Top section derived from gaugings. High flow gaugings since 2007 informed new rating applied to flows above 0.465m - leading to slight increases in high flows across period of record. Digitised record prior to 01/11/1970 is considered unsuitable for derivation of reliable peak flows.

Flow regime

Minimal interference from PWS.

The flow record

Water Year 1971/1972 is rejected as the true AMAX occurs during missing period and likely to be substantially higher. Drop in flow August 2022 due to debris being cleared from the weir. Full period of record peak flow data reviewed and released in August 2021 (WINFAP Files v10).

Descriptions from the National River Flow Archive (UKCEH). NRFA station record ↗

Gauge Details

How this gauging station is built and how long it has measured (NRFA / UKCEH).

Gauge type
Crump weir
Operating since
1968
Station datum
131.0 mAOD
Flow record
1968–2024 · 56 yrs · 100% complete
Peak-flow record
since 1964
Hydrometric area
28
Measured by
Environment Agency

Frequently asked questions

Is the River Manifold at Ilam flooding today?

The current level is 0.07m, which is below the typical range. Flooding is very unlikely at this level.

Is the river level rising or falling at Ilam?

Based on the most recent readings, the level is currently steady. The chart above shows the last 12 hours of measurements by default (up to 7 days), updated roughly every 15 minutes.

What is a normal level for the River Manifold at Ilam?

The typical range at this station is 0.10m to 0.52m, based on Environment Agency historical data. Levels above 0.52m are higher than usually seen and may indicate a flood risk.

How often is this river level data updated?

Readings are supplied by the Environment Agency gauge. FloodRadar checks for updates roughly every 15 minutes; the timestamp above shows how recent the latest available reading is.

Embed this gauge on your website

Free live river-level widget — ideal for parish councils, angling clubs and local sites. Updates automatically.

Preview

📮 Flood risk by postcode near this gauge

Postcodes within 5 km with properties in the Environment Agency’s rivers-and-sea flood-risk bands:

Check any UK postcode’s flood risk →

🏠 Buying or renting around here? Get the Property Flood-Risk Report for any English postcode — official risk band, recorded floods, warning history, river behaviour and nearby storm overflows. £19 one-off. Learn more →