Get notified about Ewelme — tick as many as you like, they all share the notify settings below.
Alert me when (tick one or more)
⤴Unusual rise — FloodRadar+Top 1% rise rate for this gauge.
Height for "Above a height"
Drag the line on the chart, or type a value:mASD
Quick pick:
You'll be notified when this gauge is rising more than 0.10 m/hr — a sign of rapidly increasing water levels.
You'll be notified when a new storm-overflow (sewage) discharge starts within ~3 km of this gauge, based on the water companies' near-real-time feeds.
Notify by (tick one or more)
Your browser will ask permission, then you'll get a notification even when FloodRadar isn't open.
On iPhone: tap Share → Add to Home Screen first, then open it from there and set the alert. Show me how
Each one is saved as its own alert — pause or remove them individually any time.
Not an emergency service — if in danger call 999. Alerts rely on
EA/SEPA/NRW data and are best-efforts. Terms
Current Level
0.070 mASD
▬ Steady
24h Max
0.075 mASD
24h Min
0.070 mASD
Typical Range
0.04 - 0.46
mASD
Highest Recorded
1.51 mASD
11 Mar 2014
Since Jul 1991
Current level is 5% of this
🚽Sewage overflows nearby
Recent Water Levels
🌍 floodradar.co.uk
1 day
EA forecast (official)
Prediction V2
Prediction Eris
Nimbus beta
Experimental model fusing soil moisture, river flow, groundwater and catchment
character. The shaded band is its 10–90% range, widened so that about 80% of recent outcomes fall inside it.
Under evaluation — not yet promoted, so treat as a second opinion.
River Flow
90 days
Daily mean discharge (m³/s) with the daily min–max band, from the EA Hydrology API. Flow is the volume of water passing the gauge — often a more direct flood signal than level.
Flow Data: Daily mean flow (m³/s) to 6 Oct (2 days behind — the EA publishes each day's mean a day or two after it ends; unchecked, provisional)via EA Hydrology
Warnings apply to a whole flood area, not necessarily this exact spot. Years before 2006 aren't covered by the EA's historic record.
See also the Ewelme flood history.
Flood areas linked to this gauge
Flood warnings and alerts are issued for whole areas. These are the 3 areas linked to this gauge, nearest first.
🌊 Groundwater-fedSlow and steady — fed largely by groundwater, so levels change gradually, not in sudden spikes.
Your catchment is all the land that drains rainfall into the river above this gauge. Its character — how
steep, wet, wooded, urban or chalky that land is — decides how fast rain here turns into a rising river. A steep, bare or clay
catchment is “flashy” (rises and falls quickly, floods easily); a flat, chalk or well-wooded one is
slow and steady. The tiles below put numbers to that; the flow-duration curve reads left-to-right
from the river’s typical high flows (Q5) down to its low flows (Q95) — a steep curve means a flashy river.
The physical character of the land that drains to this gauge, and how it shapes its flood response — from the National River Flow Archive (UKCEH).
Baseflow Index
0.93
groundwater-fed — slow & steady
Avg Annual Rainfall
737 mm/yr
1991–2020 · +3% since 1941–70
Urban Extent
1.1%
largely rural
Highest Daily Mean Flow
0.227 m³/s
15 Mar 2014 · daily mean, not the instantaneous peak
Flow-Duration Curve
Daily flow (m³/s) exceeded each % of the time — a steep curve is flashy, a flat one is steady. Q5 high · Q50 median · Q95 low.
Land Cover (2023)
Woodland 17%Grassland 28%Arable 53%Urban 1%
Arable 63% → 53% since 1990
Photos
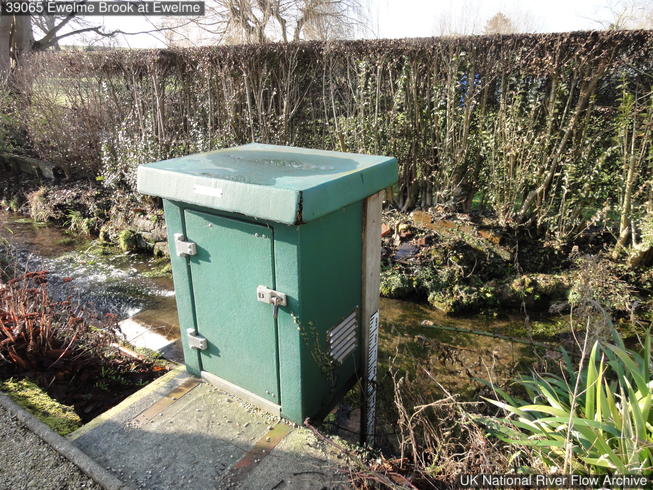
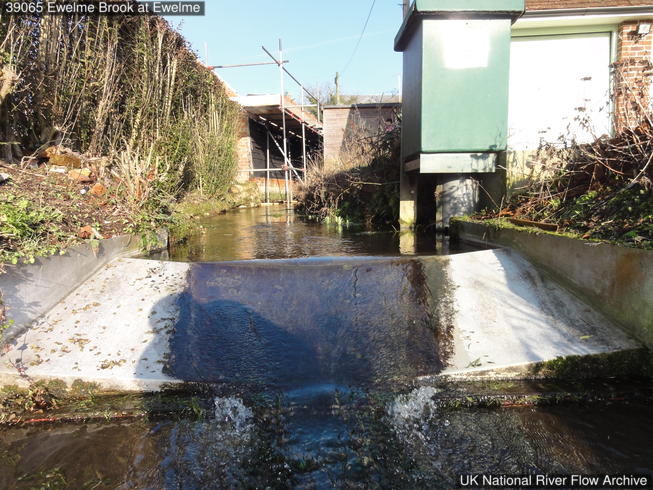
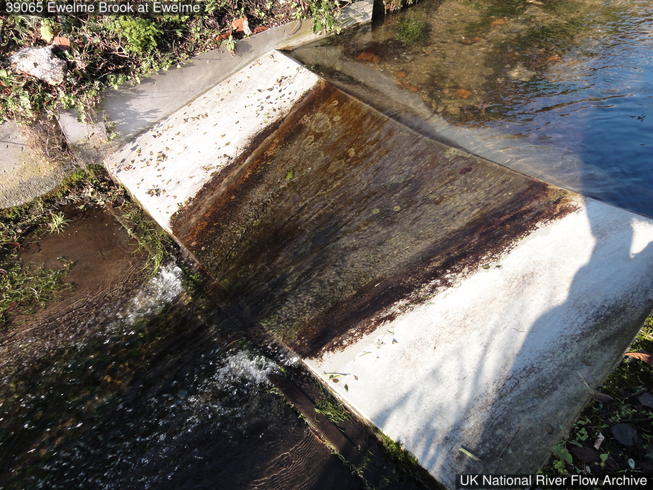
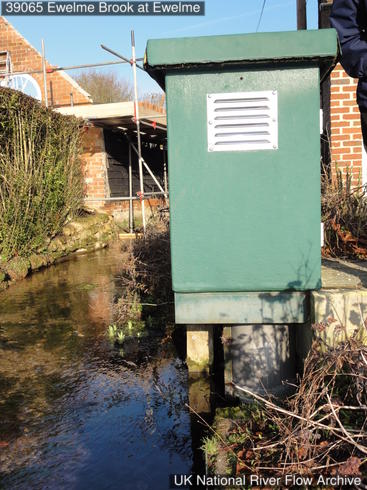
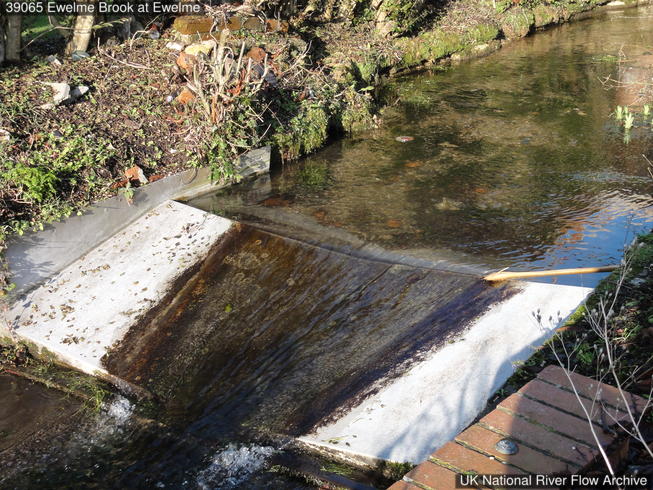
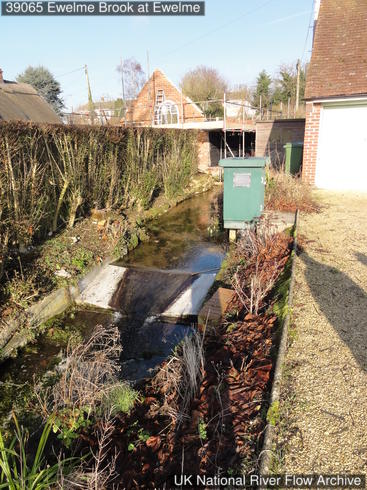
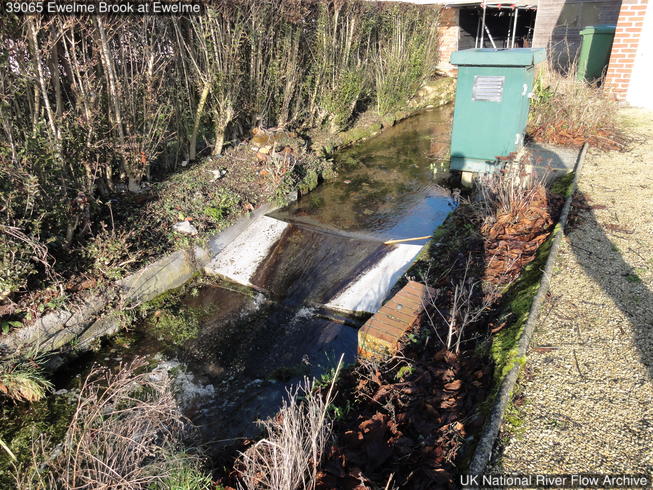
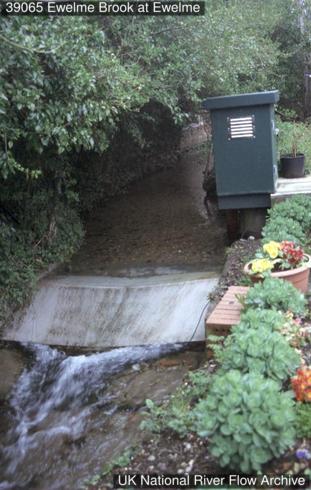
Gauging-station photographs from the National River Flow Archive (UKCEH).
Headwater gauging station, based in a chalk catchment, that flows into the middle sections of the River Thames.
More detail
The catchment
A rural/agricultural catchment developed on the scarp-slope of the Chilterns (Chalk with some Drift cover). Ewelme village is the largest settlement. Groundwater catchment is smaller than the topographical catchment.
The station
Flat V weir (width: 2m) installed in 1980 superseding (after 4-yr break) and built on top of a thin-plate weir (width: 1.524m). Significant pre-1950 artificial channel re-alignment in Ewelme.
How it measures flow
Water level measured by radar sensor with pressure sensor for backup. Originally, a shaft encoder was used. Very long weir tail does not cause drowning as critical flow is achieved. Limited head - algal growth on crest can be a problem - flow is assumed (but not confirmed) to remain modular. Tail level is not measured. Gravel from river bed can build up on apron. Weeds (water crowfoot) can build up on apron when they are cut and not removed from the upstream channel.
Flow regime
Natural, stable flow regime (but local surface runoff can produce sub-daily events). Occasional bypassing via informal sluice upstream. Pristine chalk stream, gravel bed (but largely impermeable in some reaches). Cress beds downstream can impact flows through action of sluices (e.g. summer 2018). Upstream in-channel weed growth and clearance can impact flows.
The flow record
Missing data from June 1976 to April 1980 due to weir replacement works. 2000/01 daily flows outstanding.
How this gauging station is built and how long it has measured (NRFA / UKCEH).
Gauge type
Flat-V weir
Operating since
1970
Station datum
65.9 mAOD
Flow record
1970–2024 · 54 yrs · 91% complete
Hydrometric area
39
Measured by
Environment Agency
Nearby Groundwater
Soil Moisture
Possible storm-overflow correlation
Frequently asked questions
Is the Ewelme Brook at Ewelme flooding today?
The current level is 0.07m, which is within the typical range of 0.04 to 0.46m. Flooding is unlikely at this level.
Is the river level rising or falling at Ewelme?
Based on the most recent readings, the level is currently steady. The chart above shows the last 12 hours of measurements by default (up to 7 days), updated roughly every 15 minutes.
What is a normal level for the Ewelme Brook at Ewelme?
The typical range at this station is 0.04m to 0.46m, based on Environment Agency historical data. Levels above 0.46m are higher than usually seen and may indicate a flood risk.
How often is this river level data updated?
Readings are supplied by the Environment Agency gauge. FloodRadar checks for updates roughly every 15 minutes; the timestamp above shows how recent the latest available reading is.
Embed this gauge on your website
Free live river-level widget — ideal for parish councils, angling clubs and local sites. Updates automatically.
Preview
📮 Flood risk by postcode near this gauge
Postcodes within 5 km with properties in the Environment Agency’s rivers-and-sea flood-risk bands:
 FloodRadar
Log inCreate free account
FloodRadar
Log inCreate free account