 FloodRadar
Log inCreate free account
FloodRadar
Log inCreate free account
FloodRadar
Log inCreate free account
FloodRadar
Log inCreate free account
Get notified about South Wigston — tick as many as you like, they all share the notify settings below.
Each one is saved as its own alert — pause or remove them individually any time.
Not an emergency service — if in danger call 999. Alerts rely on EA/SEPA/NRW data and are best-efforts. Terms
Geographic coordinates may reflect the access point for the gauge, and not the precise location in the watercourse that it is taking readings from.
Gauges connected to this river, and others nearby. A distance “by river” follows the river on the map; any other is in a straight line.
Distances by river: OS Open Rivers. Contains OS data © Crown copyright and database rights 2026.
Storm overflows whose water reaches this gauge on the mapped river network, nearest first by distance along the river. The status is each water company's monitor: it says whether an overflow is discharging, not how much or what it contains.
10 storm overflows are traced upstream of this gauge, the nearest 170 m away along the river. 0 report discharging now, 10 report not discharging.
2 more further upstream, up to 20.6 km away along the river.
Within 6 km in a straight line, but the river map cannot say whether their water passes this gauge.
40 more within 6 km whose connection is not known.
These are the water companies' monitor statuses; a spill does not by itself explain a change in the gauge level. River connections and distances are traced on OS Open Rivers (edition 2026-04), which leaves out many small channels. Explore the sewage map →
Contains OS data © Crown copyright and database rights 2026.
Loading rainfall and weather data...
In a typical year this gauge reaches its typical high of 1.61 m on about 24 days. This year so far: 30 days.
Counted from each day's highest reading. Days with missing or implausible readings are left out. The darker part is days above 2.19 m, the level this gauge tops only a few days a year.
Official Environment Agency warnings issued since 2006 for the 16 flood areas linked to this gauge (nearest 1.3 km away).
Most recent flood warning: 1 Mar 2026 — River Soar at Braunstone
| Year | Warnings | Alerts |
|---|---|---|
| 2026 | 20 | 23 |
| 2025 | 7 | 8 |
| 2024 | 15 | 24 |
| 2023 | 3 | 13 |
| 2022 | 0 | 7 |
| 2021 | 0 | 7 |
| 2020 | 1 | 15 |
| 2019 | 0 | 23 |
| 2018 | 0 | 7 |
| 2017 | 0 | 4 |
| 2016 | 2 | 11 |
| 2015 | 0 | 4 |
| 2014 | 0 | 16 |
| 2013 | 0 | 15 |
| 2012 | 3 | 14 |
| 2010 | 0 | 6 |
| 2009 | 0 | 7 |
| 2008 | 0 | 33 |
| 2007 | 0 | 64 |
| 2006 | 0 | 23 |
Warnings apply to a whole flood area, not necessarily this exact spot. Years before 2006 aren't covered by the EA's historic record. See also the South Wigston flood history.
Flood warnings and alerts are issued for whole areas. These are the 16 areas linked to this gauge, nearest first.
Your catchment is all the land that drains rainfall into the river above this gauge. Its character — how steep, wet, wooded, urban or chalky that land is — decides how fast rain here turns into a rising river. A steep, bare or clay catchment is “flashy” (rises and falls quickly, floods easily); a flat, chalk or well-wooded one is slow and steady. The tiles below put numbers to that; the flow-duration curve reads left-to-right from the river’s typical high flows (Q5) down to its low flows (Q95) — a steep curve means a flashy river.
The physical character of the land that drains to this gauge, and how it shapes its flood response — from the National River Flow Archive (UKCEH).
Flow affected by: effluent returns, industrial / agricultural abstraction.
Gauging-station photographs from the National River Flow Archive (UKCEH).
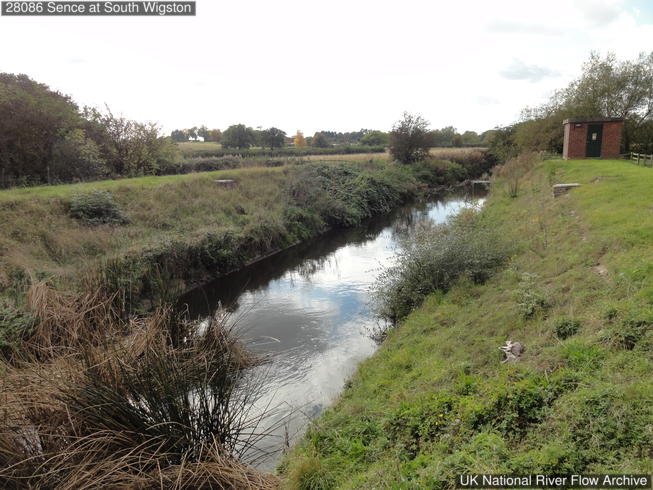 20 Oct 2016 Electromagnetic measuring section, taken looking upstream from right bank. Stage 0.626m
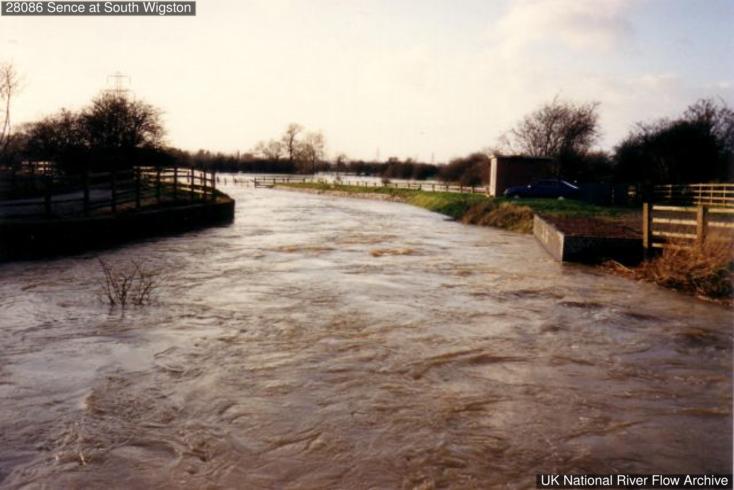 24 Jan 1998 At high flows
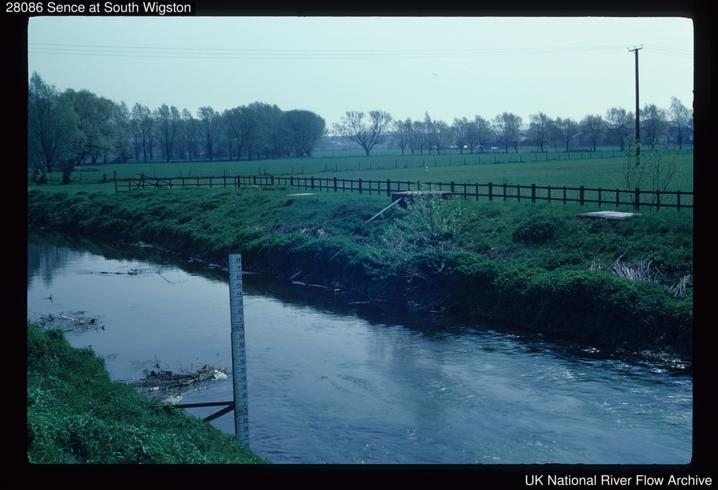 1985
1985
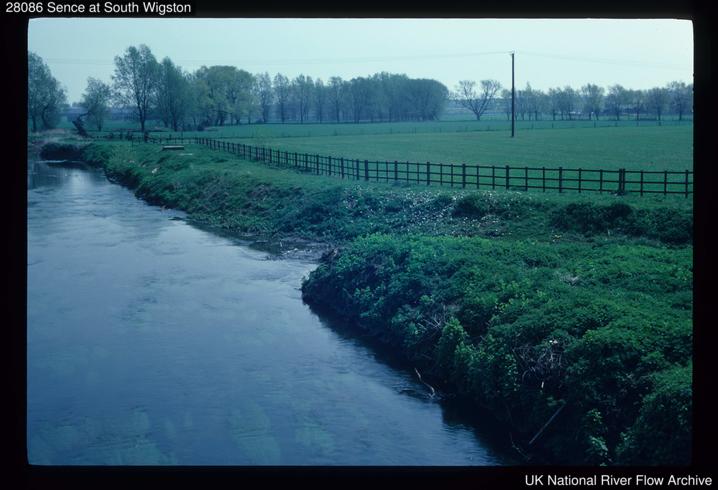 1985
1985
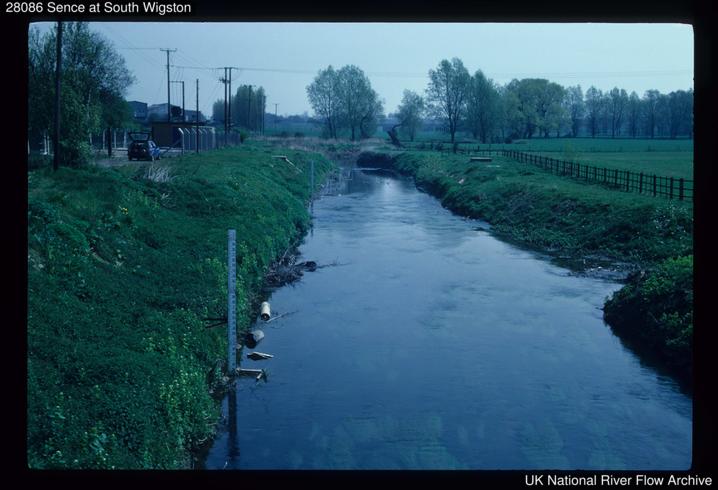 1985
1985
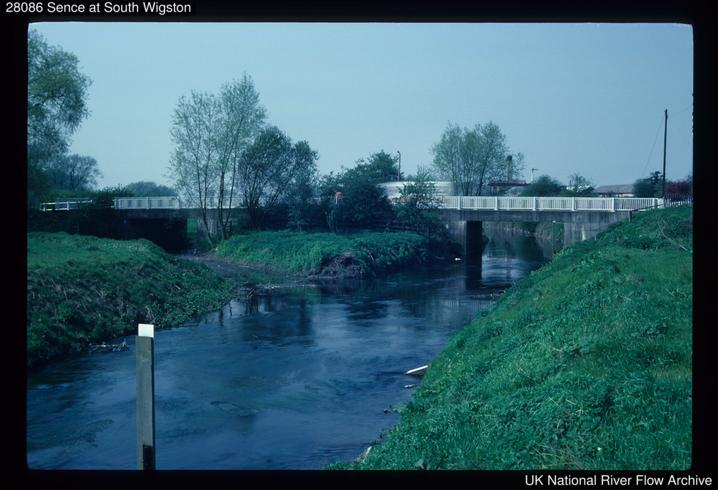 1985
1985
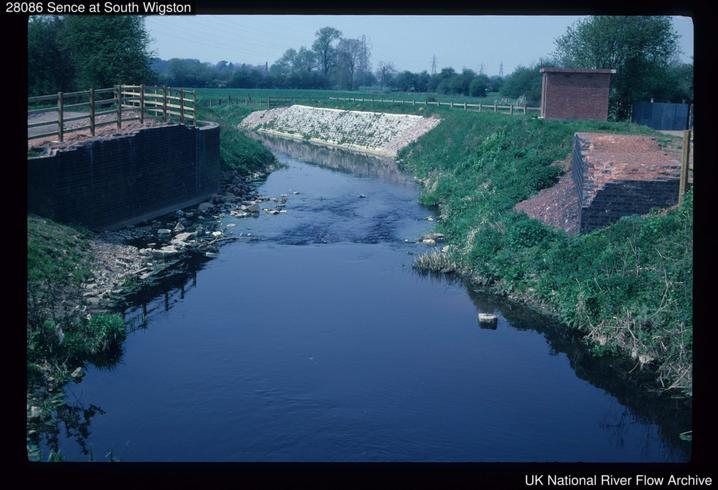 1985
1985
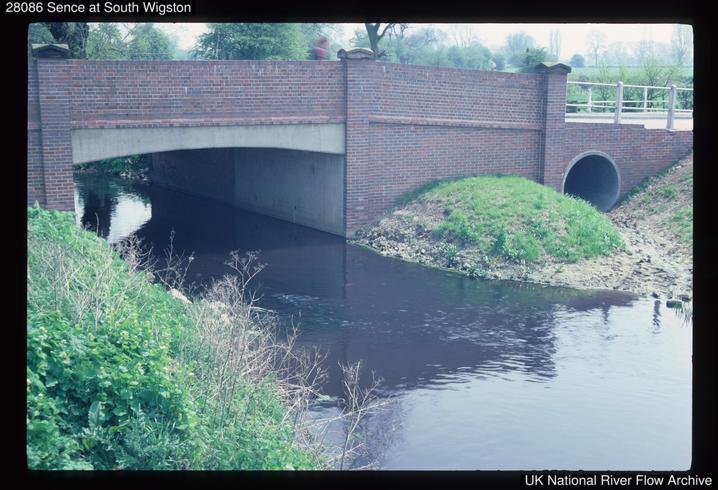 1985
1985
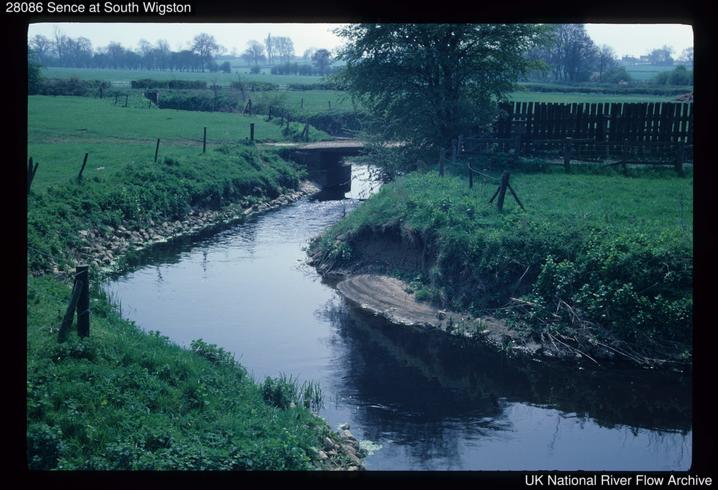 1985
1985
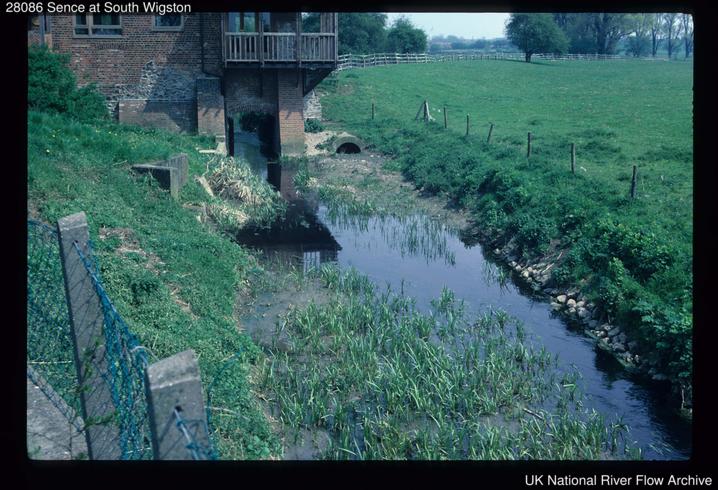 1985 Millstream confluence upstream of station
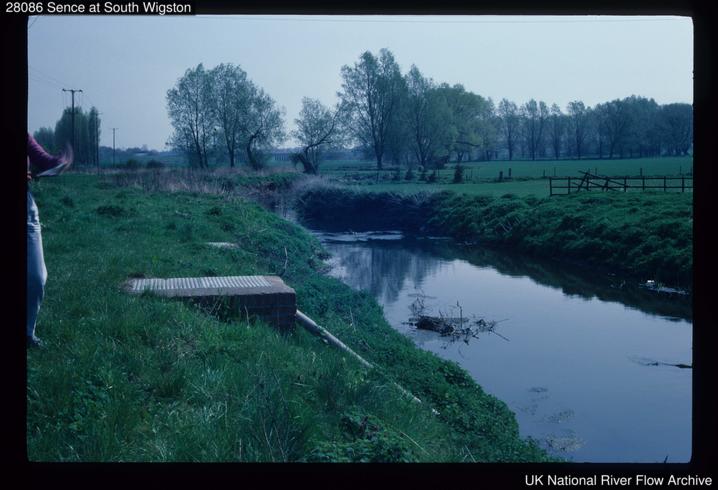 1985
1985
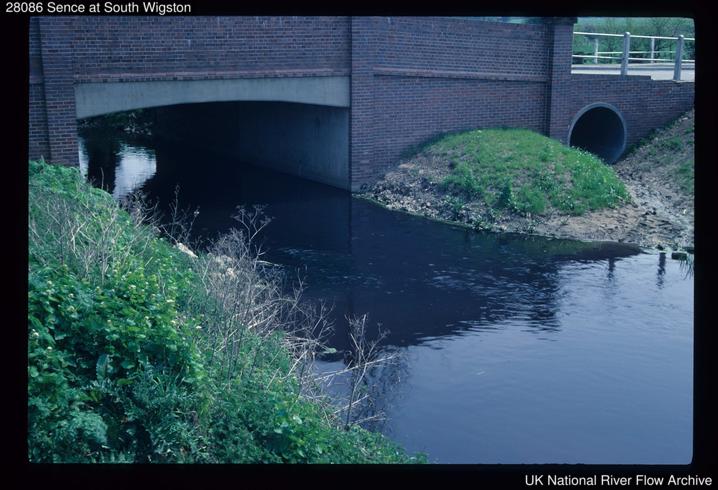 1985
1985
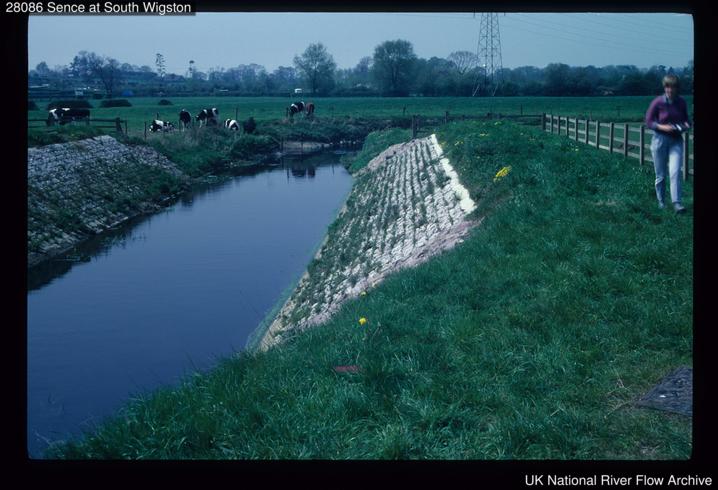 1985
1985
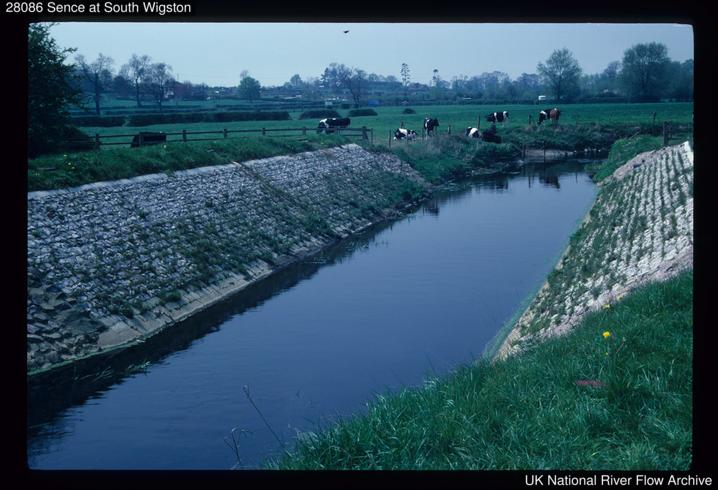 1985
1985
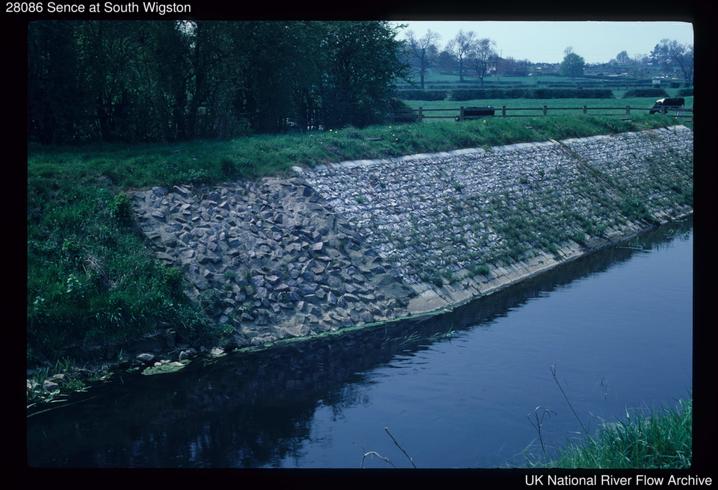 1985
1985
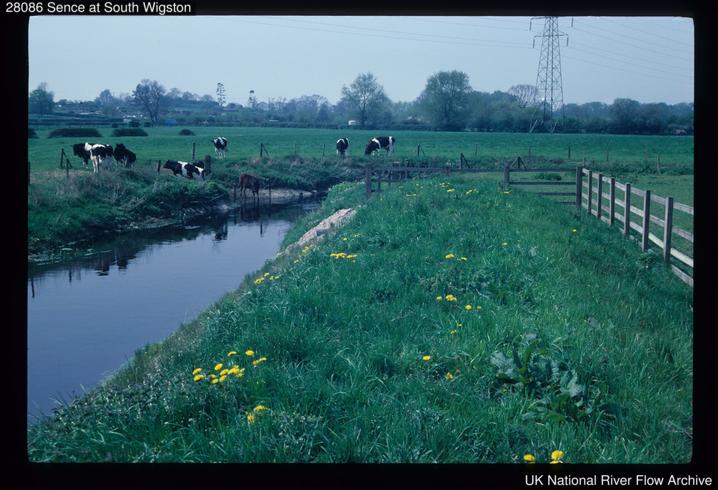 1985
1985
Photos © NRFA / UKCEH & the measuring authority — shown at web resolution. Full gallery on the NRFA ↗
LaserFlow Index Velocity gauge post-2017. Previously Electromagnetic gauge set in 1:1 formalised banks. Replaces Blaby (28054), daily flow records combined, but not peak flows.
Descriptions from the National River Flow Archive (UKCEH). NRFA station record ↗
How this gauging station is built and how long it has measured (NRFA / UKCEH).
The current level is 0.95m, which is within the typical range of 0.60 to 1.61m. Flooding is unlikely at this level.
Based on the most recent readings, the level is currently rising. The chart above shows the last 12 hours of measurements by default (up to 7 days), updated roughly every 15 minutes.
When little or no rain has fallen for a while, a river level gradually drops as the water stored in the ground and soil drains away with nothing to replace it. This is called baseflow recession and is normal in dry spells. A gentle decline like this is expected and is not a sign of a problem — downstream gauges often recede a little faster than headwaters further upstream, and levels recover once rain returns.
The typical range at this station is 0.60m to 1.61m, based on Environment Agency historical data. Levels above 1.61m are higher than usually seen and may indicate a flood risk.
Readings are supplied by the Environment Agency gauge. FloodRadar checks for updates roughly every 15 minutes; the timestamp above shows how recent the latest available reading is.
Free live river-level widget — ideal for parish councils, angling clubs and local sites. Updates automatically.
Postcodes within 5 km with properties in the Environment Agency’s rivers-and-sea flood-risk bands:
FloodRadar helper · beta