Storm overflows whose water reaches this gauge on the mapped river network, nearest first by distance along the river. The status is each water company's monitor: it says whether an overflow is discharging, not how much or what it contains.
2 storm overflows are traced upstream of this gauge, the nearest 5.5 km away along the river. 0 report discharging now, 2 report not discharging.
Southern Water · into Black Brook · 2.5 km away in a straight line · its watercourse is not on the river map
5 spills · 13 hours in 2025
Not discharging now · last
13 more within 6 km whose connection is not known.
3 other overflows within 6 km are downstream of this gauge or on another branch of the river network, so they are not listed.
These are the water companies' monitor statuses; a spill does not by itself explain a change in the gauge level. River connections and distances are traced on OS Open Rivers (edition 2026-04), which leaves out many small channels. Explore the sewage map →
🌊 Mixed responseA balance of quick runoff and slower groundwater baseflow.
Your catchment is all the land that drains rainfall into the river above this gauge. Its character — how
steep, wet, wooded, urban or chalky that land is — decides how fast rain here turns into a rising river. A steep, bare or clay
catchment is “flashy” (rises and falls quickly, floods easily); a flat, chalk or well-wooded one is
slow and steady. The tiles below put numbers to that; the flow-duration curve reads left-to-right
from the river’s typical high flows (Q5) down to its low flows (Q95) — a steep curve means a flashy river.
The physical character of the land that drains to this gauge, and how it shapes its flood response — from the National River Flow Archive (UKCEH).
Baseflow Index
0.64
mixed response
Avg Annual Rainfall
930 mm/yr
1991–2020 · +8% since 1941–70
Urban Extent
5.3%
partly urbanised
Median Annual Flood
18.02 m³/s
QMED — typical yearly peak flow
Highest Daily Mean Flow
18.60 m³/s
6 Nov 2000 · daily mean, not the instantaneous peak
Flow-Duration Curve
Daily flow (m³/s) exceeded each % of the time — a steep curve is flashy, a flat one is steady. Q5 high · Q50 median · Q95 low.
Land Cover (2023)
Woodland 14%Grassland 41%Arable 32%Urban 13%
Grassland 37% → 41% since 1990
Flow affected by: groundwater abstraction.
Photos
Gauging-station photographs from the National River Flow Archive (UKCEH).
Flat-V weir installed 1991, 250m upstream of the M27 river crossing. Flashy response but with appreciable baseflow.
More detail
The catchment
Permeable headwaters (Chalk) with impervious Eocene clays dominating below the headwaters. Upper Chalk with isolated patches of clay-with-flints covers northern half of catchment & a narrow belt on Southern boundary. Reading Beds (predominantly clays), London Clay, Bagshot Sand & Bracklesham Beds (sands & clays) occur between the two chalk outcrops, with alluvium dominating the valleys. On leaving the central basin the river cuts through the edge of the Portsdown Chalk ridge and flows over Tertiary clays into the sea. A largely rural catchment, but with an expanding developed area encompassing Waterlooville, Denmead & Purbrook in the headwaters.
The station
Flat-V weir (1:10 cross slope, 6 m wide) installed 1991, 250m upstream of the M27 river crossing. Replaced a compound critical depth flume with total crest width 4.8m, comprising central low flow channel and two side channels (0.39 m above central channel) which operated from 0.567 m3/s and was occasionally blocked by debris.
How it measures flow
Modular limit 1.0m, stage peaks truncated at ~20 cumecs; weir drowns. Numerous potential bypassing locations u/s of the gauge; bypassing occurs before water level reaches the top of wing walls. Upstream of the station floodplain is typically less than 150m wide and river meanders from one side to the other. Flooding exacerbated by Wallington Bridge 1km d/s of the weir, and spring tides can extend u/s of the bridge. Between the gauge and M27 crossing the river consists of a series of interconnected pools with mobile channel bed, considerable bank erosion and debris in the channel. A 3m section of bank u/s of the station has been stabilised with rock and concrete, the d/s bank has been stabilised with loose rock covered by fencing. Bridge across weir can make current meter measurement difficult in flood flows. Two peak flow ratings applied across period of record, the most recent is valid from November-1991. Current rating developed from hydraulic model and confirmed by gaugings.
Flow regime
Flashy response but with appreciable baseflow - zero flow in 1976 only. Groundwater catchment smaller than topographic catchment. In the upper catchment, runoff is negligible, except during wet winters when the bournes or lavants (seasonal streams) are running. Ground water abstraction causes a net diminution in runoff. Spray irrigation can significantly reduce summer flows. No direct surface water abstractions. Runoff from M27 motorway, 200m downstream of weir. Springs at Havant derive water from the Wallington area, therefore the Wallington is not typical of the area as a whole.
The flow record
Peak flow data only available from October 1976 onwards. Pre-1991, flows were truncated at ~10 cumecs (due to bypassing via the upstream eastern bank) and estimated using 42003. No data 20/07/91-03/12/91 due to station reconstruction. Full period of record peak flow data reviewed and released in October 2018 (WINFAP Files v7).
How this gauging station is built and how long it has measured (NRFA / UKCEH).
Gauge type
Flat-V weir
Operating since
1951
Station datum
3.7 mAOD
Flow record
1951–2024 · 73 yrs · 99% complete
Peak-flow record
since 1951
Hydrometric area
42
Measured by
Environment Agency
Nearby Groundwater
Soil Moisture
Frequently asked questions
Is NORTH FAREHAM GS flooding today?
The latest recorded level is 0.05m. Compare it with the recent history on the chart above to judge whether levels are unusually high.
Is the river level rising or falling at NORTH FAREHAM GS?
Based on the most recent readings, the level is currently steady. The chart above shows the last 12 hours of measurements by default (up to 7 days), updated roughly every 15 minutes.
Why is the level slowly falling?
When little or no rain has fallen for a while, a river level gradually drops as the water stored in the ground and soil drains away with nothing to replace it. This is called baseflow recession and is normal in dry spells. A gentle decline like this is expected and is not a sign of a problem — downstream gauges often recede a little faster than headwaters further upstream, and levels recover once rain returns.
How often is this river level data updated?
Readings are supplied by the Environment Agency gauge. FloodRadar checks for updates roughly every 15 minutes; the timestamp above shows how recent the latest available reading is.
Embed this gauge on your website
Free live river-level widget — ideal for parish councils, angling clubs and local sites. Updates automatically.
Preview
📮 Flood risk by postcode near this gauge
Postcodes within 5 km with properties in the Environment Agency’s rivers-and-sea flood-risk bands:
 FloodRadar
Log inCreate free account
FloodRadar
Log inCreate free account
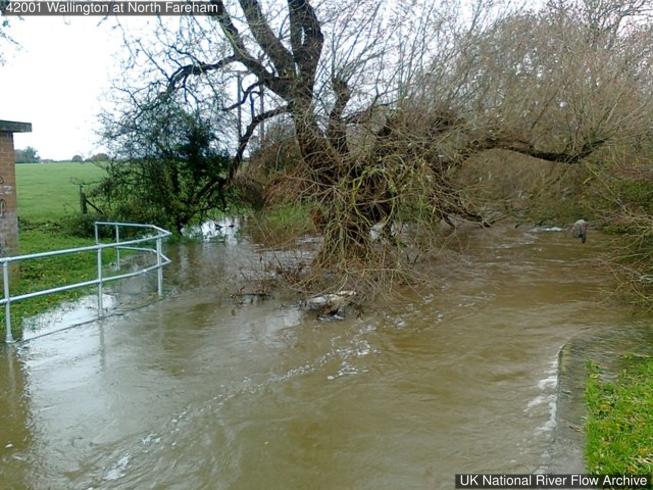 9 Nov 2010 Out of bank flow
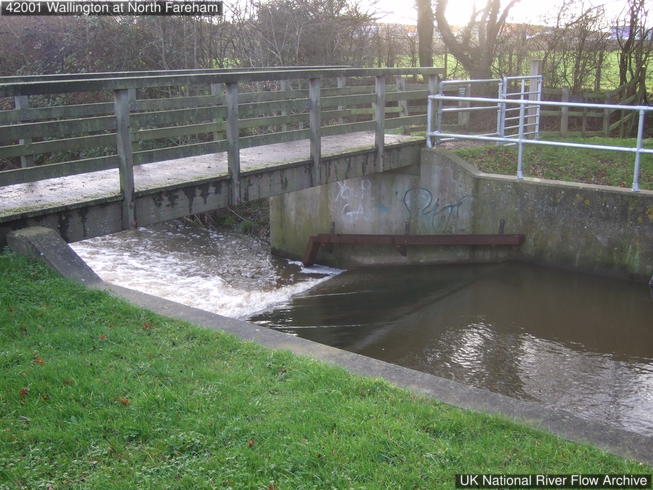 25 Nov 2009 Weir and bridge from left bank
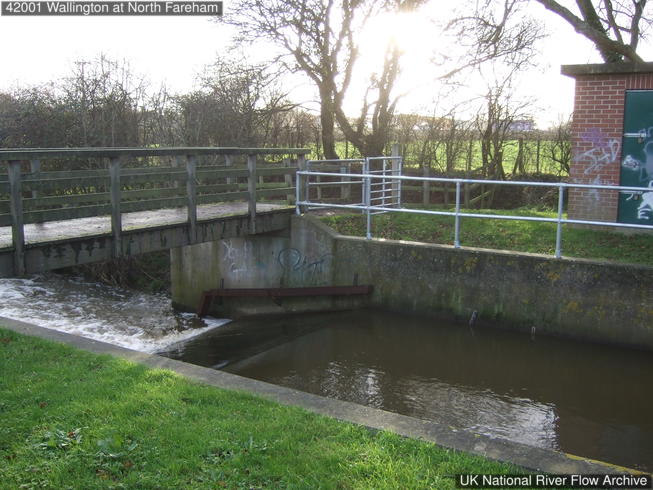 25 Nov 2009 Weir and bridge from left bank
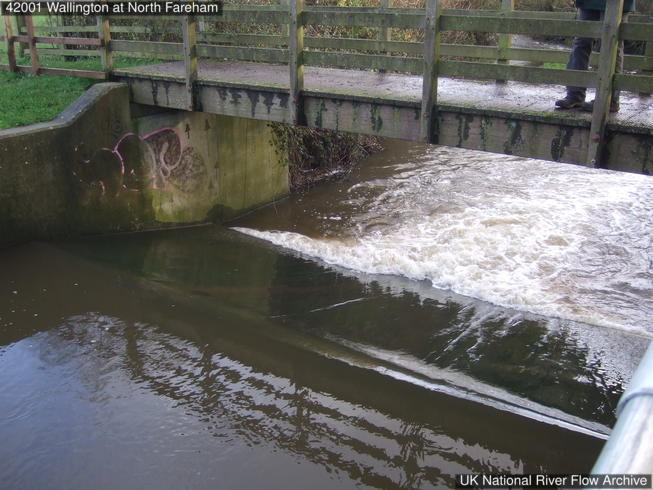 25 Nov 2009 Weir looking downatream from right bank
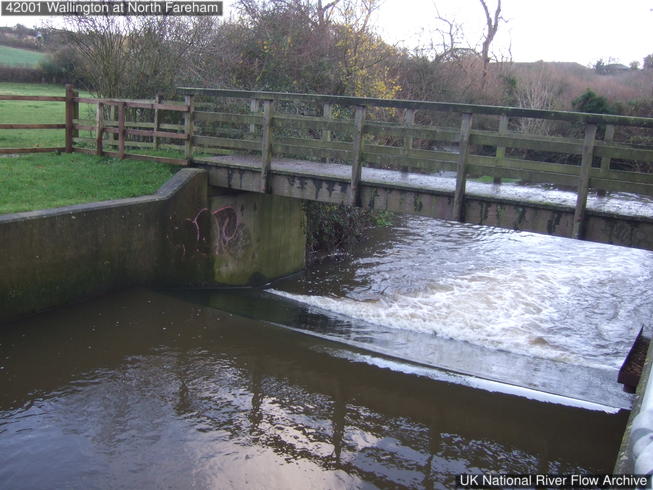 25 Nov 2009 Weir and bridge, looking downstream
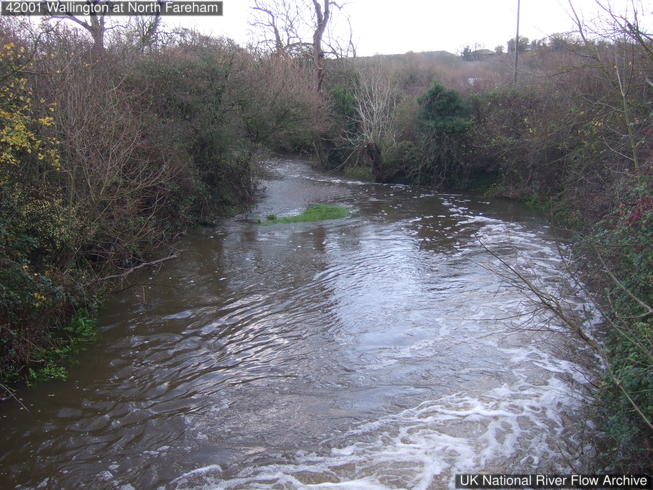 25 Nov 2009 Channel downstream of weir
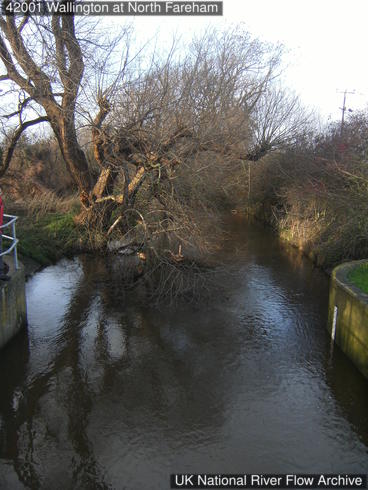 25 Nov 2009 View upstream from bridge over structure
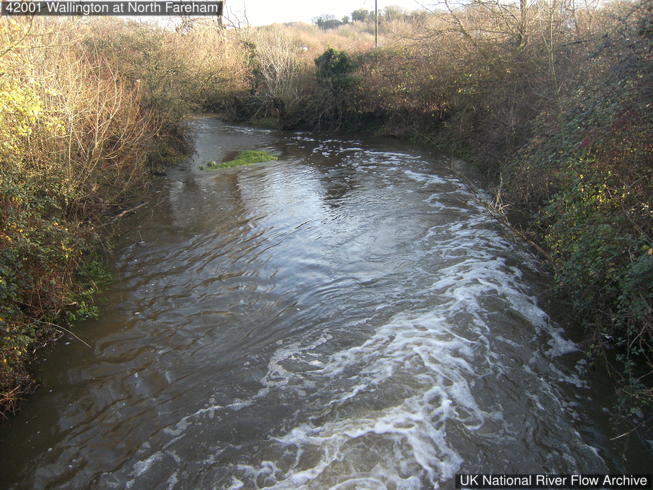 25 Nov 2009 View downstream from bridge over structure
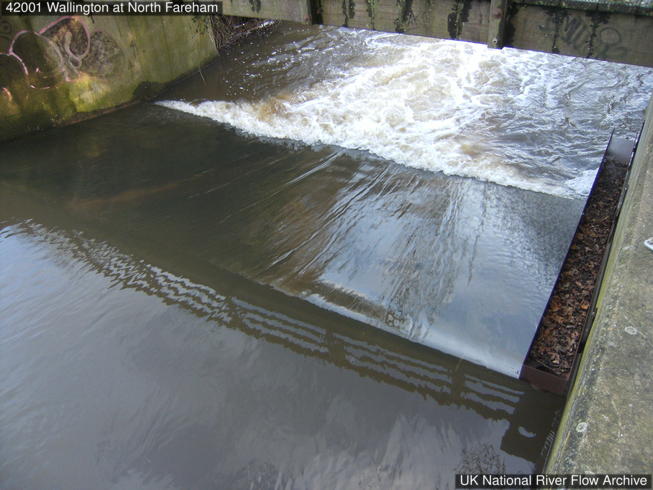 25 Nov 2009 View of flat V weir and bridge over structure. Note: elver pass.
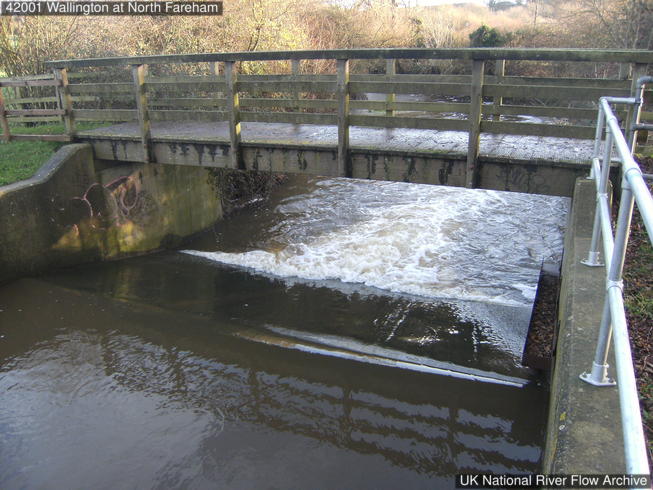 25 Nov 2009 View of flat V weir and bridge over structure from hut immediately upstream.
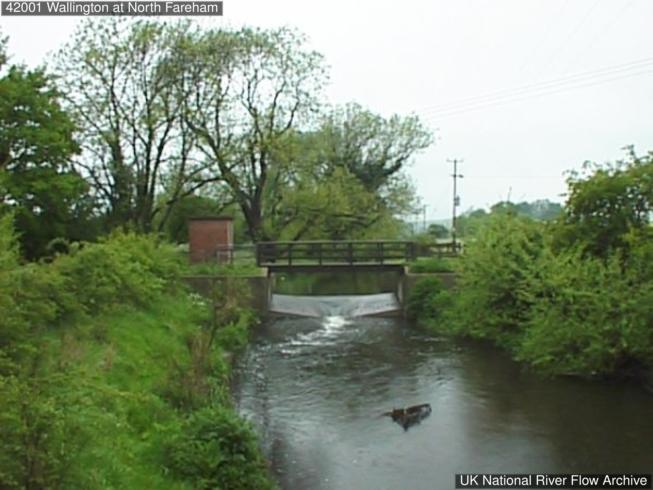 Upstream view to gauging station