Get notified about Compstall — tick as many as you like, they all share the notify settings below.
Alert me when (tick one or more)
⤴Unusual rise — FloodRadar+Top 1% rise rate for this gauge.
Height for "Above a height"
Drag the line on the chart, or type a value:m
Quick pick:
You'll be notified when this gauge is rising more than 0.10 m/hr — a sign of rapidly increasing water levels.
You'll be notified when a new storm-overflow (sewage) discharge starts within ~3 km of this gauge, based on the water companies' near-real-time feeds.
Notify by (tick one or more)
Your browser will ask permission, then you'll get a notification even when FloodRadar isn't open.
On iPhone: tap Share → Add to Home Screen first, then open it from there and set the alert. Show me how
Each one is saved as its own alert — pause or remove them individually any time.
Not an emergency service — if in danger call 999. Alerts rely on
EA/SEPA/NRW data and are best-efforts. Terms
Current Level
0.096 m
▬ Steady
24h Max
0.117 m
24h Min
0.096 m
Typical Range
0.08 - 1.70
m
Highest Recorded
1.83 m
EA official record
1.81 in our data (since Mar 1971)
Current level is 5% of this
🚽Sewage overflows nearby
Recent Water Levels
🌍 floodradar.co.uk
1 day
EA forecast (official)
Prediction V2
Prediction Eris
Nimbus beta
Experimental model fusing soil moisture, river flow, groundwater and catchment
character. The shaded band is its 10–90% range, widened so that about 80% of recent outcomes fall inside it.
Under evaluation — not yet promoted, so treat as a second opinion.
River Flow
90 days
Daily mean discharge (m³/s) with the daily min–max band, from the EA Hydrology API. Flow is the volume of water passing the gauge — often a more direct flood signal than level.
Flow Data: Daily mean flow (m³/s) to 6 Oct (2 days behind — the EA publishes each day's mean a day or two after it ends; unchecked, provisional)via EA Hydrology
Storm overflows whose water reaches this gauge on the mapped river network, nearest first by distance along the river. The status is each water company's monitor: it says whether an overflow is discharging, not how much or what it contains.
23 storm overflows are traced upstream of this gauge, the nearest 200 m away along the river. 0 report discharging now, 22 report not discharging, and for 1 the monitor is offline or has not reported, so their status is not known.
United Utilities · into Bredbury Stream Via Sws · 3.9 km away in a straight line · its watercourse is not on the river map
7 spills · 9 hours in 2025
Not discharging now · last
18 more within 6 km whose connection is not known.
38 other overflows within 6 km are downstream of this gauge or on another branch of the river network, so they are not listed.
These are the water companies' monitor statuses; a spill does not by itself explain a change in the gauge level. River connections and distances are traced on OS Open Rivers (edition 2026-04), which leaves out many small channels. Explore the sewage map →
Warnings apply to a whole flood area, not necessarily this exact spot. Years before 2006 aren't covered by the EA's historic record.
See also the Compstall flood history.
Flood areas linked to this gauge
Flood warnings and alerts are issued for whole areas. These are the 14 areas linked to this gauge, nearest first.
🌊 Steep & flashySteep catchment sheds rain quickly — expect fast, sharp rises after heavy rain.
Your catchment is all the land that drains rainfall into the river above this gauge. Its character — how
steep, wet, wooded, urban or chalky that land is — decides how fast rain here turns into a rising river. A steep, bare or clay
catchment is “flashy” (rises and falls quickly, floods easily); a flat, chalk or well-wooded one is
slow and steady. The tiles below put numbers to that; the flow-duration curve reads left-to-right
from the river’s typical high flows (Q5) down to its low flows (Q95) — a steep curve means a flashy river.
The physical character of the land that drains to this gauge, and how it shapes its flood response — from the National River Flow Archive (UKCEH).
Baseflow Index
0.37
mixed response
Avg Annual Rainfall
1,392 mm/yr
1991–2020 · +6% since 1941–70
Urban Extent
3.3%
partly urbanised
Median Annual Flood
52.49 m³/s
QMED — typical yearly peak flow
Highest Daily Mean Flow
77.60 m³/s
21 Dec 1991 · daily mean, not the instantaneous peak
Flow-Duration Curve
Daily flow (m³/s) exceeded each % of the time — a steep curve is flashy, a flat one is steady. Q5 high · Q50 median · Q95 low.
Crump weir located on the Etherow, just upstream of the confluence with the Goyt. Half of the catchment drains through Longendale reservoirs, with a significant effect on the flow regime.
More detail
The catchment
The River Etherow rises on the Pennine watershed above Longdendale. Geology comprises mostly Millstone Grit, and Boulder Clay in the lower catchment with peat covered moorland in the headwaters. Steeper slopes are drift free. A predominantly rural catchment in the headwaters with mixed urban and farmland in the lower reaches. Market towns of Glossop and Chapel-en-le-Frith provide some urban runoff. No catchment changes known.
The station
A single crest Crump weir opened March 1969; 18m wide, wing walls 2.8m high, located 0.5km upstream of Goyt confluence.
How it measures flow
Station further contained by flood banks, but there is a low point on the right bank just upstream of the structure at approx 2.2m. Crest tapping readings were used to establish a non-modular rating; tapping no longer used due to stones lodged in pressure tapping points. A downstream recorder was installed in October 2006 to investigate drowning. Event in February 2011 removed shoal downstream and appears that onset of drowning is now at a higher stage. More gaugings needed to confirm. No cableway. High flow gaugings have been taken by current meter from the road bridge upstream and from late 2004 have been taken by ADCP immediately upstream of the weir, within the retaining walls. One peak flow rating applied across period of record based on gaugings, with top-end based on modelling.
Flow regime
Half the catchment drains through Longdendale reservoirs, used for public water supply, with significant effect upon flows (e.g. drops in flow in Nov and Dec 2021).
The flow record
Daily maximum flows can sometimes be higher in the Etherow at Compstall than the Goyt at Marple Bridge. For instance, the AMAX values, which are usually on the same peak, were not in December 2024 and this could be due to more artificial water release via the Longdendale chain of Reservoirs upstream of Etherow.
Timing, not cause. Gauges can move together simply because the same rain fell on both.
Frequently asked questions
Is the River Etherow at Compstall flooding today?
The current level is 0.10m, which is within the typical range of 0.08 to 1.70m. Flooding is unlikely at this level.
Is the river level rising or falling at Compstall?
Based on the most recent readings, the level is currently steady. The chart above shows the last 12 hours of measurements by default (up to 7 days), updated roughly every 15 minutes.
What is a normal level for the River Etherow at Compstall?
The typical range at this station is 0.08m to 1.70m, based on Environment Agency historical data. Levels above 1.70m are higher than usually seen and may indicate a flood risk.
How often is this river level data updated?
Readings are supplied by the Environment Agency gauge. FloodRadar checks for updates roughly every 15 minutes; the timestamp above shows how recent the latest available reading is.
Embed this gauge on your website
Free live river-level widget — ideal for parish councils, angling clubs and local sites. Updates automatically.
Preview
📮 Flood risk by postcode near this gauge
Postcodes within 5 km with properties in the Environment Agency’s rivers-and-sea flood-risk bands:
 FloodRadar
Log inCreate free account
FloodRadar
Log inCreate free account
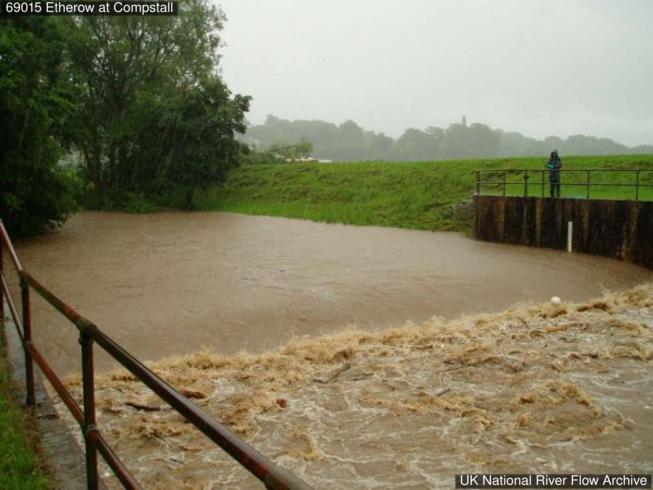 4 Jul 2007 Stage 1.04m; weir approx. 80% submerged
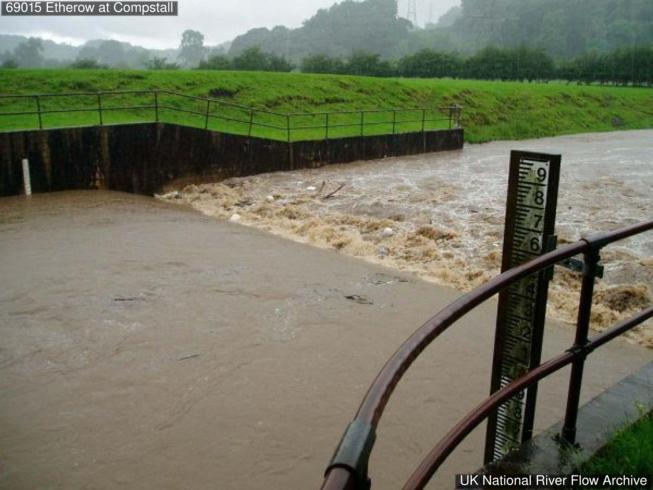 4 Jul 2007 Stage 1.04m; weir approx. 80% submerged
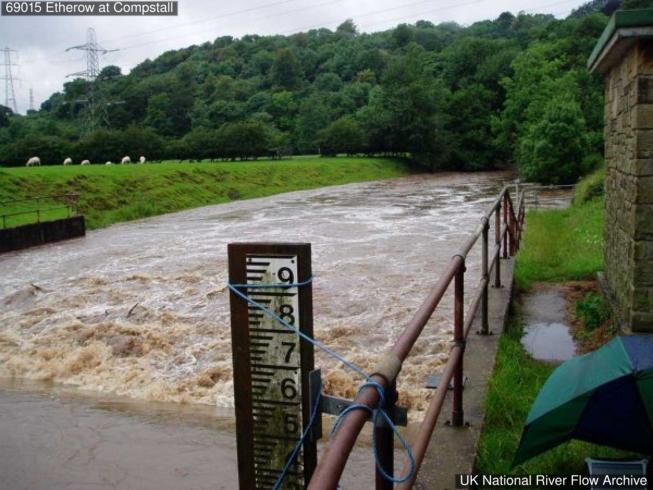 4 Jul 2007 Stage 1.04m; weir approx. 80% submerged
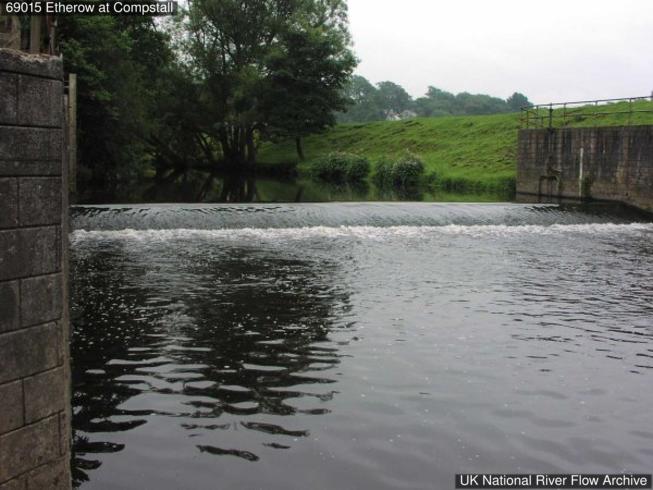 View u/s over weir from R bank
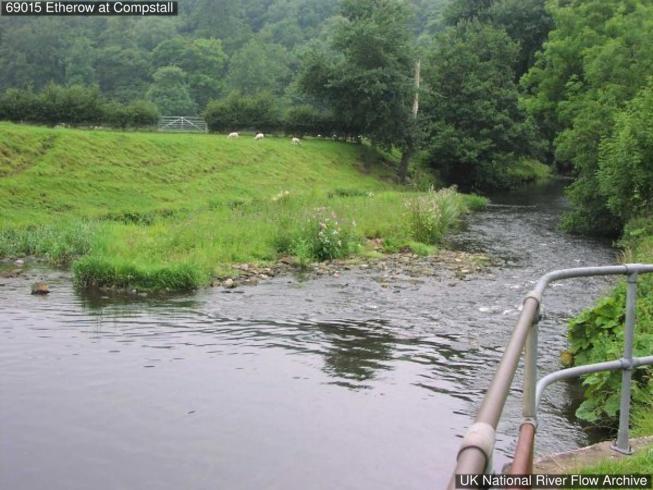 View d/s from weir R bank
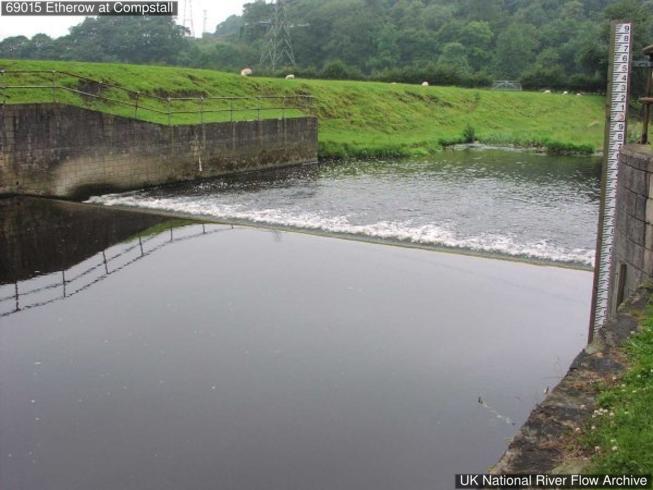 View d/s over weir from R bank