None of the storm overflows FloodRadar holds is traced upstream of this gauge on the mapped river network. That is not the same as none: the map leaves out many small streams and culverts, so an overflow it cannot place may still drain here, and not every company publishes every overflow. Those nearby are listed below.
Nearby, connection not known
Within 6 km in a straight line, but the river map cannot say whether their water passes this gauge.
South West Water · into Mounts Bay · 3.4 km away in a straight line · discharges to the sea, an estuary or tidal water
13 spills · 54 hours in 2025
Not discharging now · last
1 other overflow within 6 km is downstream of this gauge or on another branch of the river network, so it is not listed.
These are the water companies' monitor statuses; a spill does not by itself explain a change in the gauge level. River connections and distances are traced on OS Open Rivers (edition 2026-04), which leaves out many small channels. Explore the sewage map →
🌊 Groundwater-fedSlow and steady — fed largely by groundwater, so levels change gradually, not in sudden spikes.
Your catchment is all the land that drains rainfall into the river above this gauge. Its character — how
steep, wet, wooded, urban or chalky that land is — decides how fast rain here turns into a rising river. A steep, bare or clay
catchment is “flashy” (rises and falls quickly, floods easily); a flat, chalk or well-wooded one is
slow and steady. The tiles below put numbers to that; the flow-duration curve reads left-to-right
from the river’s typical high flows (Q5) down to its low flows (Q95) — a steep curve means a flashy river.
The physical character of the land that drains to this gauge, and how it shapes its flood response — from the National River Flow Archive (UKCEH).
Baseflow Index
0.67
groundwater-fed — slow & steady
Avg Annual Rainfall
1,266 mm/yr
1991–2020 · +5% since 1941–70
Urban Extent
1.8%
largely rural
Median Annual Flood
5.71 m³/s
QMED — typical yearly peak flow
Highest Daily Mean Flow
11.46 m³/s
27 Dec 1979 · daily mean, not the instantaneous peak
Flow-Duration Curve
Daily flow (m³/s) exceeded each % of the time — a steep curve is flashy, a flat one is steady. Q5 high · Q50 median · Q95 low.
Velocity area station modified multiple times throughout lifespan. ADVP installed in 2009 to improve high flows and account for a variable backwater effect from Loe Pool.
More detail
The catchment
Natural catchment. 70% drains the Carnmenellis Granite. The remainder is made up of grits, shales and slates of Devonian age. Upper catchment mainly granite, lower catchment fine granite slates of the Maylor series. Subdued response to rainfall. Mainly agricultural. Good example of a Cornish stream. No major changes to catchment.
The station
Velocity area station. Originally (1968) a velocity-area station in a formalised rectangular channel, 4m wide, with natural bed control. Informal broad-crested weir and sluice to power a water wheel, installed in 1975, 3m d/s as a temporary control which was then removed in 1976. Between 1976-1977 return to natural control followed by installation of a broad crested weir in 1977. Original gauging station closed and demolished in 1989. In 2003, the site reopened as a natural channel section in the same location as the original gauging station for low flows. In 2009, the station was relocated 200m upstream to County Bridge to estimate high flows.
How it measures flow
At the original site, the station was bypassed during high flow events. Early ratings based on current meter gaugings for natural section. CEH rating used for post-weir period until station closed in 1989 as this provides the best fit to gaugings for this period. Backwatering effect can be influenced by penstock control at Loe Pool outflow. Measurement recommenced in 2003 at the old gauging station location but without the old hydraulic structures which were removed during the upgrade of the flood defence scheme. An ADVP was installed in 2009 to improve the existing rating and account for the backwater effect. The current site here has not yet bypassed (2021). One common upper limb covering the period 2003 to present with variable lower limbs. Flows from 2009 onwards are calculated using a combination of index velocity and stage-discharge, typically the stage-discharge relationship is used and then the index rating takes over at peak flows. The station is known to experience backwatering when Loe Pool is > 5.1 mAOD, but the direct flow measurement takes this into account. The ADVP has provided evidence that the backwater effect has so far (2021) had a greater impact causing elevated levels on the falling limb. Multiple peak flow ratings across period of record.
Flow regime
Moderate influence from public water supply and industrial abstractions, and mine pumping.
The flow record
Full period of record peak flow data reviewed and released in August 2024 (WINFAP Files v13).
How this gauging station is built and how long it has measured (NRFA / UKCEH).
Gauge type
Gauging structure
Operating since
1968
Station datum
4.5 mAOD
Flow record
1968–2024 · 56 yrs · 74% complete
Peak-flow record
since 1968
Hydrometric area
48
Measured by
Environment Agency
Nearby Groundwater
Soil Moisture
Frequently asked questions
Is HELSTON COUNTY BRIDGE flooding today?
The latest recorded level is 0.00m. Compare it with the recent history on the chart above to judge whether levels are unusually high.
Is the river level rising or falling at HELSTON COUNTY BRIDGE?
Based on the most recent readings, the level is currently steady. The chart above shows the last 12 hours of measurements by default (up to 7 days), updated roughly every 15 minutes.
How often is this river level data updated?
Readings are supplied by the Environment Agency gauge. FloodRadar checks for updates roughly every 15 minutes; the timestamp above shows how recent the latest available reading is.
Embed this gauge on your website
Free live river-level widget — ideal for parish councils, angling clubs and local sites. Updates automatically.
Preview
📮 Flood risk by postcode near this gauge
Postcodes within 5 km with properties in the Environment Agency’s rivers-and-sea flood-risk bands:
 FloodRadar
Log inCreate free account
FloodRadar
Log inCreate free account
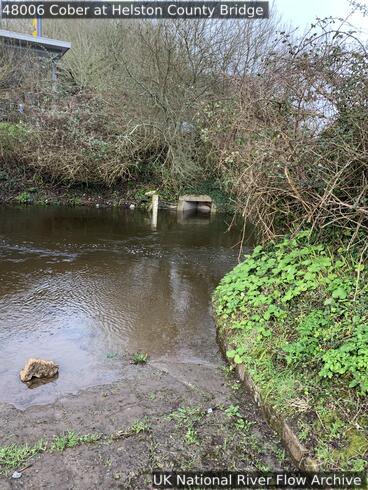 26 Nov 2012 High flows
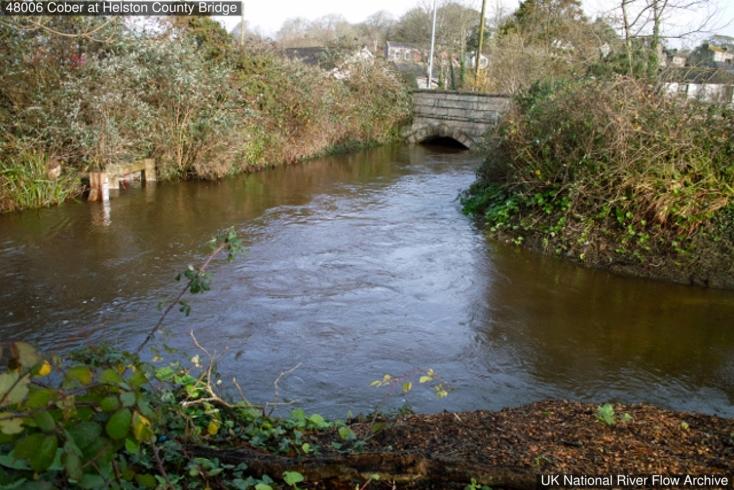 25 Nov 2012 Looking upstream towards road bridge.
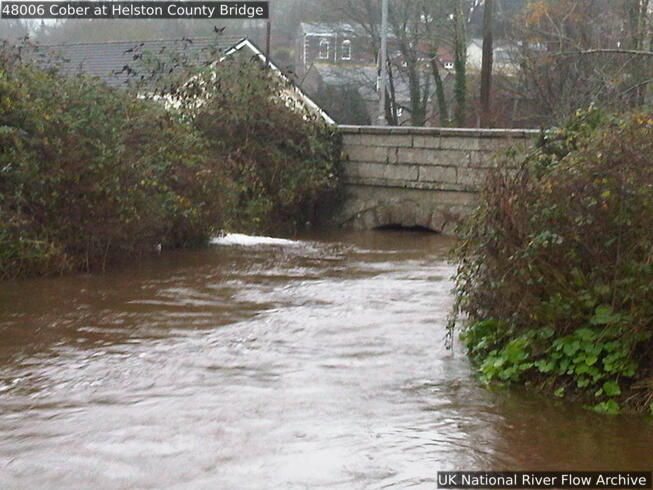 22 Nov 2012 High flows
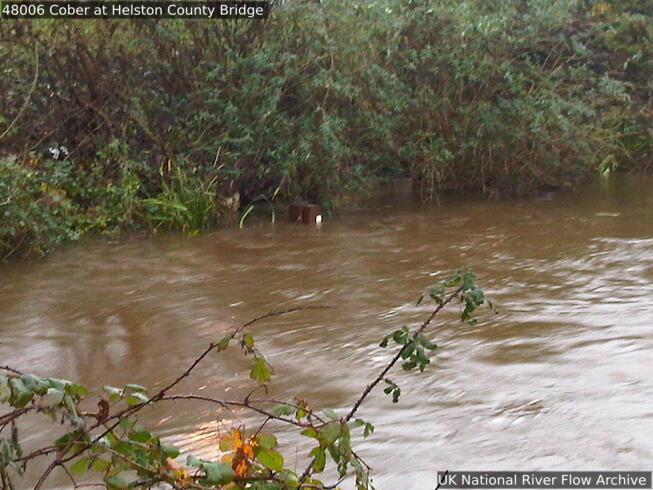 22 Nov 2012 High flows
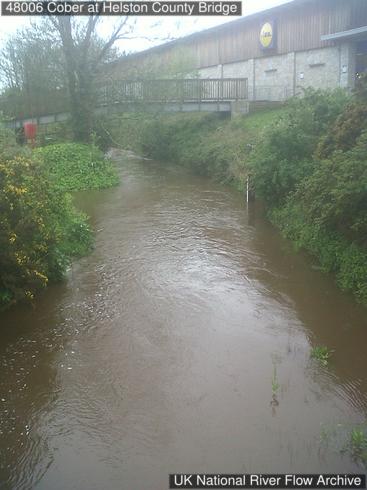
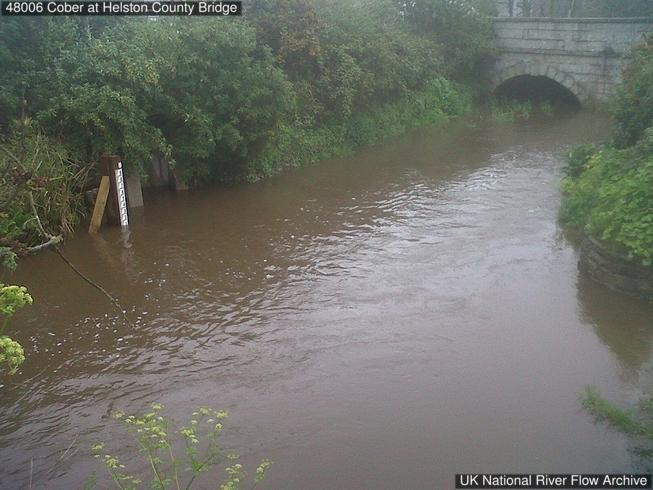
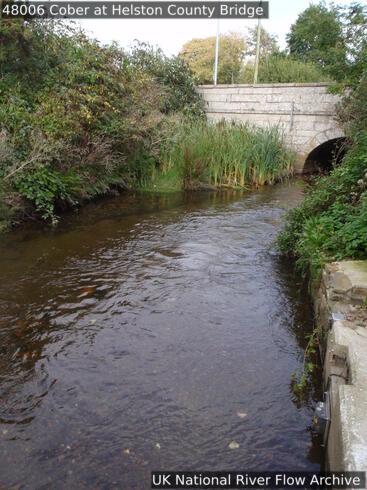 Section showing both banks
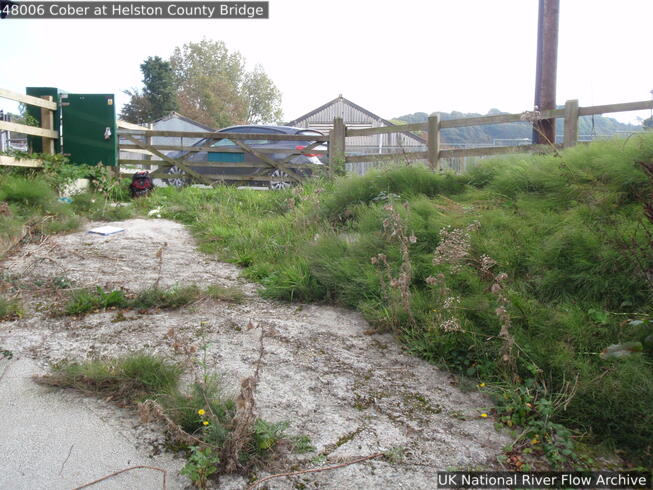 View of hut from river
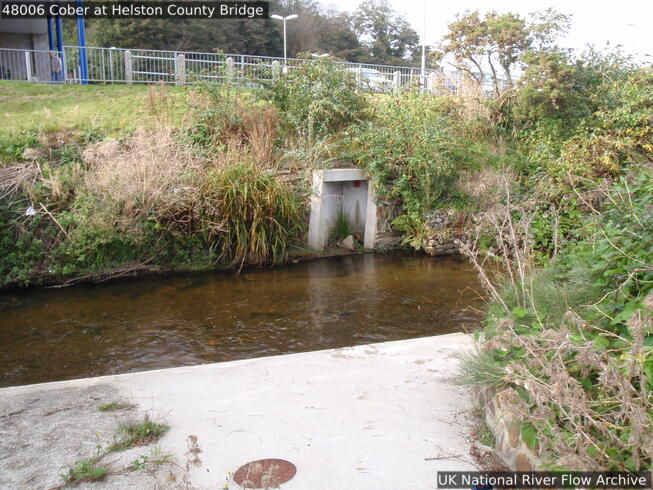 View of river from hut