 FloodRadar
Log inCreate free account
FloodRadar
Log inCreate free account
How much rain fell in Penruddock, Westmorland and Furness? Daily, weekly and monthly totals averaged over the Environment Agency rain gauges within 15km, updated every 15 minutes.
Next 24 hours: about 4.9mm of rain forecast for the area around Penruddock, heaviest in the hour to Tue 01:00 (2.1mm).
A computer model forecast (DWD ICON) for a square about 15 km across, updated 17:05 UK time. It is a forecast, not a measurement, and not a Met Office forecast. Weather data by Open-Meteo (CC BY 4.0).
Daily totals for UK days from the same computer model; "dry" means under 0.2mm. Forecasts further ahead are less certain.
| Gauge | Distance | Yesterday | 7 days | October | Today |
|---|---|---|---|---|---|
| Rainfall gauge nr Penruddock | 0.0km | 26.2mm | 97.1mm | 193.8mm | 3.2mm |
| Rainfall gauge nr Dockray nr Dockray | 5.8km | 23.2mm | 111.4mm | 249.9mm | 9.1mm |
| Rainfall gauge nr Newton Reigny nr Newton Reigny | 7.8km | 16.0mm | 70.6mm | 134.8mm | 1.9mm |
Daily totals 26 Sep–25 Oct. Wettest day: 39.4mm.
21 days with at least 0.2mm of rain so far this October at Rainfall gauge nr Penruddock, against a full-month average of 22.2 rain days (based on 3 months of records at this gauge).
2026 so far: 1,319 mm (1 Jan to 25 Oct), against 1,181 mm by the same date in an average year (2000–2025) — 12% wetter.
One bar per calendar year, the average of 8 local rain gauges: the Environment Agency's quality-checked daily archive, then live telemetry for the latest months. Wettest: 2015 (2,085 mm). Driest: 2001 (1,062 mm). Average: 1,609 mm a year.
Daily totals are the average of 8 local rain gauges, for UTC days; one gauge can catch much more than the average. A storm's figure adds up the rain measured on its dates, from our list of Met Office named storms and major floods — other weather on those days counts too.
Penruddock gets about 1,425 mm of rain a year on average (wettest month December, 177 mm; driest April, 74 mm). That is wetter than the UK as a whole, which averages 1,163 mm a year.
Monthly averages in mm. Source: Met Office HadUK-Grid 1991–2020 (5 km grid), 1.0 km from the town's gauge centre. Average rainfall: HadUK-Grid v1.3.2, Met Office. Contains public sector information licensed under the Open Government Licence v3.0. UK comparison: Met Office HadUK-Grid areal series, 1991-2020, Open Government Licence v3.0.
Rain gauge River gauge Storm overflow
Nearest gauge on it: Pooley Bridge, 4.8 km away: 0.90 m Steady.
Every gauge on the River Eamont →A level is shown only when the gauge's latest reading is under 6 hours old. Distances are straight-line from the centre of Penruddock's monitored area.
6 storm overflows within 5 km of the centre of Penruddock's monitored area. None of the 5 with a live status is discharging right now, and 1 has no current status.
Event Duration Monitors show when an overflow may be spilling; they do not confirm it, and this is not advice on water quality. A live status older than two hours counts as no current status. Live status: © United Utilities storm overflow activity data, licensed under CC BY 4.0. Annual spill figures: Environment Agency Event Duration Monitoring return, © Environment Agency copyright and/or database right, Open Government Licence (OGL) v3.0.
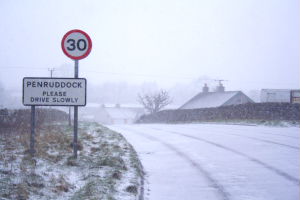
Village in Cumbria, England
Penruddock is a small village in Cumbria, England, 5.5 miles to the west of Penrith. It forms part of the civil parish of Hutton.
From Wikipedia, the free encyclopedia (CC BY-SA 4.0).
24.6mm of rain fell yesterday (25 Oct 2026), from the average of 10 rain gauges within 15km of Penruddock.
October so far: 247.0mm vs 204.4mm October average — 21% wetter (the average covers the whole month; we are 26 days in). Figures are the average of 10 rain gauges within 15km.
Rainfall gauge nr Penruddock is the nearest rain gauge, 0.0km from the centre of Penruddock's monitored area. Rain gauges can be several kilometres from the town itself, so very local downpours may not register exactly.
21 days with at least 0.2mm of rain so far this October at Rainfall gauge nr Penruddock, against a full-month average of 22.2 rain days.
2015 was the wettest year in the record since 2000, with 2,085 mm from the average of 8 local rain gauges, against an average of 1,609 mm a year. The driest was 2001, with 1,062 mm.
5 Dec 2015: 99.9 mm on average across 8 local rain gauges, and up to 156.8 mm at one of them, during Storm Desmond. Records since 1 Jan 2000.
Rainfall data: Environment Agency rain gauges, synced every 15 minutes. Daily totals are computed overnight (UTC days); "today so far" is live. Gauge distances are straight-line from the centre of Penruddock's monitored area — local rainfall can vary over short distances.
FloodRadar helper · beta
