Arun and Western Streams catchment
• Graylingwell • West Sussex • ID: E10893 • Level
(1h ago) • 4 readings/hr • 158 views
Set water level alerts
Get notified about Graylingwell — tick as many as you like, they all share the notify settings below.
Alert me when (tick one or more)
⤴Unusual rise — FloodRadar+Top 1% rise rate for this gauge.
Height for "Above a height"
Drag the line on the chart, or type a value:m
Quick pick:
You'll be notified when this gauge is rising more than 0.10 m/hr — a sign of rapidly increasing water levels.
You'll be notified when a new storm-overflow (sewage) discharge starts within ~3 km of this gauge, based on the water companies' near-real-time feeds.
Notify by (tick one or more)
Your browser will ask permission, then you'll get a notification even when FloodRadar isn't open.
On iPhone: tap Share → Add to Home Screen first, then open it from there and set the alert. Show me how
Each one is saved as its own alert — pause or remove them individually any time.
Not an emergency service — if in danger call 999. Alerts rely on
EA/SEPA/NRW data and are best-efforts. Terms
A 1.38 reading (6 Jan 2026) sits in our unverified raw history and is not treated as the record
Current level is 1% of this
⚠
Flood warning
Bosham and West Itchenor
High tides are expected to cause flooding on Monday.
Flooding is expected for 1 hour either side of Monday morning's tide at 11:00 on 26/10/2026.
The weather increases tide table values by 0.48 m. Total forecast tide is 5.42 metres Chart Datum (2.68 mAOD) at Chichester Harbour. Strong Southerly Force 6 wind. Flooding will affect Shore Road and a small number of properties in Bosham High Street and Gloucester Terrace. Water will reach the top of slipways in West Itchenor. Monday's evening tide at 23:15 on 26/10/2026 is forecast to be 34 cm lower (2.34 mAOD), with Tuesday's tides lower again, and without flood impacts. Wednesday's midday tide is currently predicted to be 2.4 mAOD, which may cause minor flood impacts to low lying land.
We are closely monitoring the situation .
Activate any flood protection products you may have.
This message will be updated by 6:00PM on Monday 26 October or as the situation changes.
High tides on Monday may lead to flooding.
Flooding is possible for 2 hours either side of Monday morning's tide at 11:00 on 26/10/2026.
The weather increases tide table values by 0.42 m. Total forecast tide is 6.40 metres Chart Datum (3.35 mAOD) at Littlehampton. Strong Southerly Force 7 wind. Mill Lane, Sidlesham will flood, making access temporarily more difficult.
Strong winds and large waves will generate lots of spray affecting the beach top properties and nearby roads in Selsey, Pagham, Bognor and Elmer. Monday's tide at 23:15 on 26/10/2026 is forecast to be 34 cm lower (3.01 mAOD) and is unlikely to cause impacts.
We are closely monitoring the situation .
Consider activating any flood protection products you may have.
This message will be updated by 6:00PM on Monday 26 October or as the situation changes.
High tides on Sunday may lead to flooding.
Flooding is possible for 1 hour either side of Sunday evening's tide at 22:30 on 25/10/2026.
The weather increases tide table values by 0.48 m. Total forecast tide is 5.24 metres Chart Datum (2.50 mAOD) at Chichester Harbour. The tide will flood Shore Road. At Bosham High Street, water will be near to or flood front door steps. Land of shore side properties around the Harbour could also be affected. Monday morning’s tide at 11:00 on 26/10/2026 is forecast to be 15cm higher.
A Flood Warning will be issued for Monday morning’s tide and isolated property flooding is expected in Bosham.
Monday evening’s tide at 23:00 will be lower and no further flooding is predicted.
We are closely monitoring the situation .
Consider activating any flood protection products you may have.
This message will be updated by 6:00PM on Monday 26 October or as the situation changes.
High tides on Monday may lead to flooding.
Flooding is possible for 2 hours either side of Monday morning's tide at 11:00 on 26/10/2026.
The weather increases tide table values by 0.43 m. Total forecast tide is 5.37 metres Chart Datum (2.63 mAOD) at Chichester Harbour. Strong Southerly Force 7 wind. Strong winds and large waves may push the tide to the top of the beach at Bracklesham, with possibility of water flowing into ditches behind. Spray will affect beach top properties at the end of West Sands Lane and Medmerry. Monday's tide at 23:15 on 26/10/2026 is forecast to be 31 cm lower (2.32 mAOD) and is unlikely to cause impacts.
We are closely monitoring the situation .
Don't put yourself or others at risk. Avoid Medmerry seafront at high tide. Stormy seas are dangerous.
This message will be updated by 6:00PM on Monday 26 October or as the situation changes.
High tides on Sunday may lead to flooding.
Flooding is possible for 2 hours either side of Sunday evening's tide at 22:30 on 25/10/2026.
The weather increases tide table values by 0.48 m. Total forecast tide is 6.27 metres Chart Datum (3.22 mAOD) at Littlehampton. Strong Westerly Force 6 wind.
Waves could cause overtopping of the beach, affecting Climping Street Car Park. A small amount of water may flow or be directed westwards along Mill Lane towards residential property in Climping Street. Monday morning’s tide at 11:00 on 26/10/2026 is forecast to be 15cm higher.
A little water may affect Climping Street on Monday morning.
Monday evening’s tide at 23:00 will be lower, but minor flood impacts could be possible.
We are closely monitoring the situation . We routinely check the condition of the beach at Climping.
Consider activating any flood protection products you may have. Access could be restricted. Take care if visiting Climping beach.
This message will be updated by 6:00PM on Monday 26 October or as the situation changes.
Experimental model fusing soil moisture, river flow, groundwater and catchment
character. The shaded band is its 10–90% range, widened so that about 80% of recent outcomes fall inside it.
Under evaluation — not yet promoted, so treat as a second opinion.
River Flow
90 days
Daily mean discharge (m³/s) with the daily min–max band, from the EA Hydrology API. Flow is the volume of water passing the gauge — often a more direct flood signal than level.
Flow Data: Daily mean flow (m³/s) to 23 Oct (2 days behind — the EA publishes each day's mean a day or two after it ends; unchecked, provisional)via EA Hydrology
Storm overflows whose water reaches this gauge on the mapped river network, nearest first by distance along the river. The status is each water company's monitor: it says whether an overflow is discharging, not how much or what it contains.
1 storm overflow is traced upstream of this gauge, the nearest 1.7 km away along the river. 0 report discharging now, 1 reports not discharging.
Southern Water · into Bremere Rife · 4.9 km away in a straight line · no mapped watercourse close enough to be sure
4 spills · 33 hours in 2025
Not discharging now · last
1 other overflow within 6 km is downstream of this gauge or on another branch of the river network, so it is not listed.
These are the water companies' monitor statuses; a spill does not by itself explain a change in the gauge level. River connections and distances are traced on OS Open Rivers (edition 2026-04), which leaves out many small channels. Sewage & storm overflows →
In a typical year this gauge reaches its typical high of 0.61 m
on about 7 days.
This year so far: 22 days.
202622 days, 14 of them high · 14 highso far
20251 day, 1 of them high · 1 high
202427 days, 17 of them high · 17 high
202327 days, 18 of them high · 18 high
20220 days
20210 days
20204 days, 1 of them high · 1 high
20190 days
20180 days
20170 days
Counted from each day's highest reading. Days with missing or implausible readings are left out.
The darker part is days above 0.67 m, the level this gauge tops only a few days a year.
Flood history near this gauge
Official Environment Agency warnings issued since 2012 for the 19 flood
areas linked to this gauge (nearest 1.5 km away).
Warnings apply to a whole flood area, not necessarily this exact spot. Years before 2006 aren't covered by the EA's historic record.
See also the Graylingwell flood history.
Flood areas linked to this gauge
Flood warnings and alerts are issued for whole areas. These are the 19 areas linked to this gauge, nearest first.
🌊 Groundwater-fedSlow and steady — fed largely by groundwater, so levels change gradually, not in sudden spikes.
Your catchment is all the land that drains rainfall into the river above this gauge. Its character — how
steep, wet, wooded, urban or chalky that land is — decides how fast rain here turns into a rising river. A steep, bare or clay
catchment is “flashy” (rises and falls quickly, floods easily); a flat, chalk or well-wooded one is
slow and steady. The tiles below put numbers to that; the flow-duration curve reads left-to-right
from the river’s typical high flows (Q5) down to its low flows (Q95) — a steep curve means a flashy river.
The physical character of the land that drains to this gauge, and how it shapes its flood response — from the National River Flow Archive (UKCEH).
Baseflow Index
0.94
groundwater-fed — slow & steady
Avg Annual Rainfall
1,054 mm/yr
1991–2020 · +9% since 1941–70
Urban Extent
0.8%
largely rural
Median Annual Flood
1.74 m³/s
QMED — typical yearly peak flow
Highest Daily Mean Flow
7.78 m³/s
14 Dec 2000 · daily mean, not the instantaneous peak
Flow-Duration Curve
Daily flow (m³/s) exceeded each % of the time — a steep curve is flashy, a flat one is steady. Q5 high · Q50 median · Q95 low.
Land Cover (2023)
Woodland 36%Grassland 30%Arable 32%Urban 2%
Grassland 21% → 30% since 1990
Flow affected by: groundwater abstraction.
Photos
Gauging-station photographs from the National River Flow Archive (UKCEH).
Flat-V weir gauging an ephemeral stream in a permeable catchment. Baseflow-dominated regime affected by significant groundwater abstraction.
More detail
The catchment
The Lavant is an ephemeral stream within a permeable catchment, with an upper steep chalk catchment on the South Downs above Westhampnett and a flat, gravel plain lower catchment. Land use is agricultural with significant woodland in the upper catchment; the lower catchment is far more developed, especially close to Graylingwell and Chichester. Church Farm Pit, a water filled worked out gravel pit, is a good indicator of groundwater levels in the lower catchment. The oldest known continuous groundwater level record exists at Chilgrove House, within the catchment. This record, dating back to 1836, gives early warning of flood flows for Chichester.
The station
Flat-V weir (crest width 5.0 m, cross-slope 1:10, maximum head 1m, capacity 6 cumecs). The River Lavant has a long history of flooding, the last major events occurring in 1960, 1994-5 and 2000.
How it measures flow
Bypassing during extreme events (e.g. Jan 1994 and Nov 2000 when peaks were ~8 cumecs - based on current-meter gaugings). November 2000 event was gauged at 7.925 m3/s; bypassing of the gauge occurred at this time with further groundwater issuing from banks into the stream downstream of the gauge. Severe weed growth especially during summer can cause structure to drown out if not cleared. Structure suffers from velocity problems (underestimation of flow) at higher flows but this has been gauged. Gauge board had levelling problems in the past, this was amended following the rating review, May 2003. Major channel works carried out for Flood Alleviation scheme after 1994 flood; review in 2003 suggested rating should change in 1994 to accommodate channel clearance work. Two ratings applied across period of record, the most recent is valid from August-1994. Hydraulic modelling was used to derive upper limbs of the current rating.
Flow regime
A winterbourne stream with baseflow-dominated regime but spring outflows can increase dramatically following exceptional rainfall. Runoff is substantially reduced by groundwater abstraction. Flood alleviation scheme for Chichester had been completed sufficiently by 1992-93 for water to be taken from the Lavant downstream of the weir, through culverts to Church Farm Pit, through Forebridge Rife and discharged to Pagham Harbour through Pagham Rife. The oldest known continuous groundwater level record exists at Chilgrove House, within the catchment. This record, dating back to 1836, gives early warning of flood flows for Chichester. The area to the east and south of Chichester has undergone large scale gravel extraction over the past 50 years, leaving many worked out pits either filled in and developed, or water filled. This has possibly enhanced groundwater levels as the bulk flow is now confined to narrow corridors between former workings.
The flow record
Extended periods with zero flow as the stream is spring fed, which can give very low AMAX flows and no POT data are presented. Some years no flow altogether (e.g. WY1995/1996 and WY1996/1997). During summer 1963, low and medium flows were gauged by current meter on portable rods at weekly intervals until the Lavant dried up; gauging was continued on the downstream side of the Marsh Lane Bridge. Complete flow record from the 1970s. Full period of record peak flow data reviewed and released in September 2023 (WINFAP Files v12).
How this gauging station is built and how long it has measured (NRFA / UKCEH).
Gauge type
Flat-V weir
Operating since
1970
Station datum
20.7 mAOD
Flow record
1970–2024 · 54 yrs · 100% complete
Peak-flow record
since 1970
Hydrometric area
41
Measured by
Environment Agency
Nearby Groundwater
Soil Moisture
Possible storm-overflow correlation
Frequently asked questions
Is the River Lavant at Graylingwell flooding today?
The current level is 0.01m, which is within the typical range of 0.00 to 0.61m. Flooding is unlikely at this level.
Is the river level rising or falling at Graylingwell?
Based on the most recent readings, the level is currently steady. The chart above shows the last 12 hours of measurements by default (up to 7 days), updated roughly every 15 minutes.
What is a normal level for the River Lavant at Graylingwell?
The typical range at this station is 0.00m to 0.61m, based on Environment Agency historical data. Levels above 0.61m are higher than usually seen and may indicate a flood risk.
How often is this river level data updated?
Readings are supplied by the Environment Agency gauge. FloodRadar checks for updates roughly every 15 minutes; the timestamp above shows how recent the latest available reading is.
Embed this gauge on your website
Free live river-level widget — ideal for parish councils, angling clubs and local sites. Updates automatically.
Preview
📮 Flood risk by postcode near this gauge
Postcodes within 5 km with properties in the Environment Agency’s rivers-and-sea flood-risk bands:
 FloodRadar
Log inCreate free account
FloodRadar
Log inCreate free account
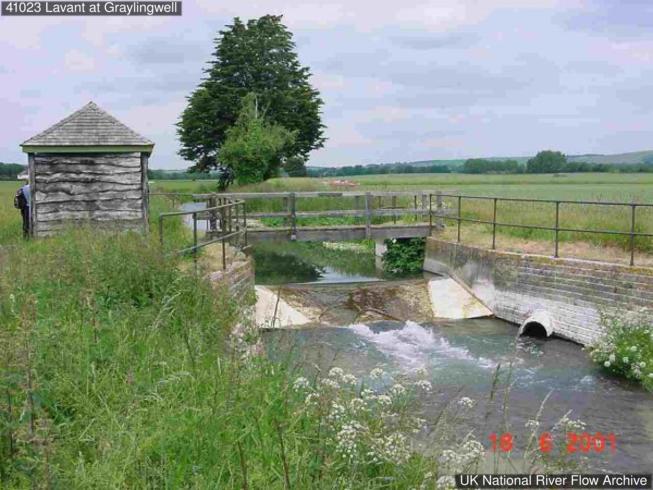 Weir and hut looking upstream from left bank
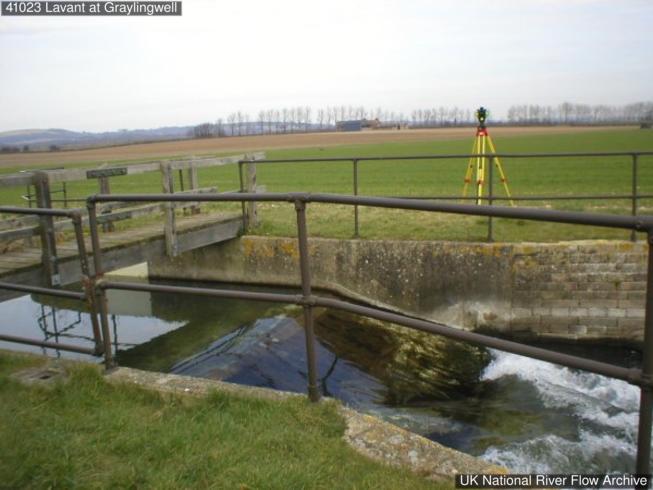 Looking across weir from left bank
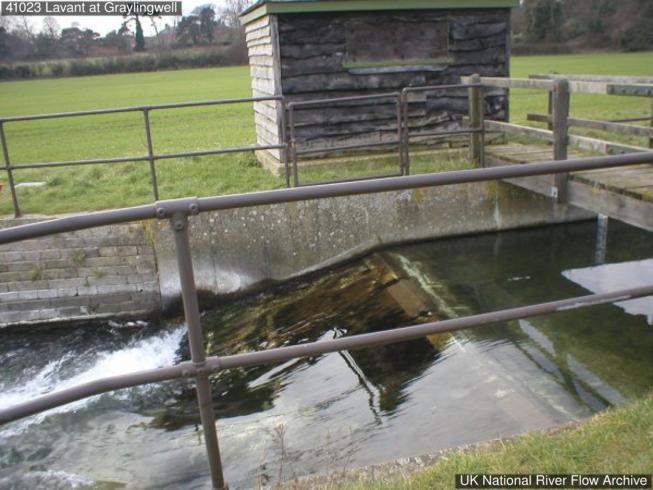 Looking across weir from right bank
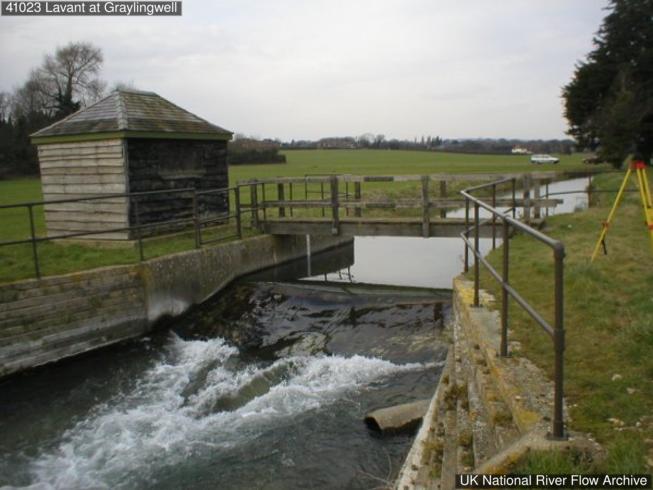 Weir and hut looking upstream from right bank