 FloodRadar
Log inCreate free account
FloodRadar
Log inCreate free account
Up to Very low likelihood
Properties in SN6 6QT sit in the Environment Agency's Very low flood-likelihood band (worst property). The band is the worst found in the postcode — it describes the land around properties (defence-adjusted, rivers & sea), not any single address, and not today's conditions.
| Likelihood band | Annual chance | Properties | Of which homes |
|---|---|---|---|
| High | greater than 3.3% | 0 | 0 |
| Medium | 1% – 3.3% | 0 | 0 |
| Low | 0.1% – 1% | 0 | 0 |
| Very low | below 0.1% | 2 | 0 |
Over a 25-year mortgage, a property in a very low-likelihood area has less than a 3% chance of flooding at least once.
SN6 6QT gets about 770 mm of rain a year on average (wettest month November, 84 mm; driest April, 52 mm). That is 34% drier than the UK as a whole, which averages 1,163 mm a year.
A thirty-year average for the surrounding area, not a measurement at this address and not a flood risk on its own: a dry area floods when a storm sits over it, and a wet one may drain away perfectly well. Source: Met Office HadUK-Grid 1991–2020 (5 km grid), 2.3 km away. Average rainfall: HadUK-Grid v1.3.2, Met Office. Contains public sector information licensed under the Open Government Licence v3.0.
The ground here sits at about 89 m above sea level and falls 9 m across the surrounding 800 m. Surface water reaching this point runs off ground lying to the north-west, 1.2 m higher.

The river map has no watercourse within 1 km of the centre of SN6 6QT.
That means this spot is not on the river map, not that there is no water here: Ordnance Survey’s river map (OS Open Rivers) leaves out small streams, ditches and culverts. Contains OS data © Crown copyright and database rights 2026.
Because properties in the very low likelihood band; 1 recorded flood outline mapped nearby; 150 official warnings since 2006.


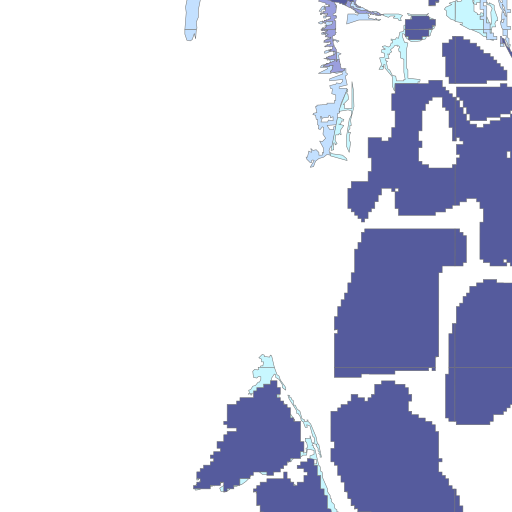
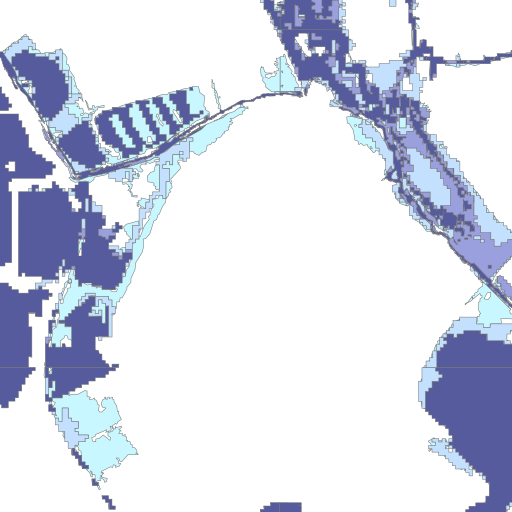

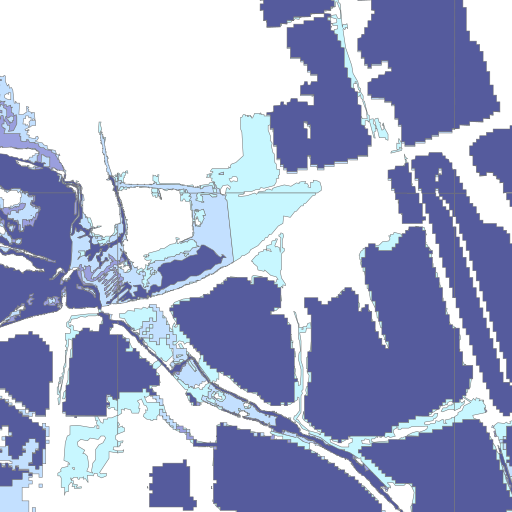


The map above shows the real EA rivers & sea likelihood cells around SN6 6QT. The small panels are illustrative previews of the report's per-layer map views — the full report draws each layer for real, plus recorded extents, defences and a building picker on an interactive map.
Warnings cover flood areas, not individual addresses.
| Date | Mapped flood extent | Approx. distance |
|---|---|---|
| Jan 1947 | 06MarchSpring1947 | ~1.9 km |
These are extents the Environment Agency has mapped, not a list of every flood. Records, not floods: no outline on the record is not evidence a place has not flooded. The full report tests whether any extent covered the exact spot.
2013-14 UK winter floods (2013, 6 warnings nearby) ▶ replay it here · Bert (2024, 4 warnings nearby) ▶ replay it here · Imogen (2016, 3 warnings nearby) ▶ replay it here · Babet (2023, 3 warnings nearby) ▶ replay it here
| Gauge | River | Distance | Typical high | Highest on record |
|---|---|---|---|---|
| Somerford Keynes | River Thames | 1.8 km | 1.60 m | 1.59 m |
| South Cerney | River Churn | 2.1 km | 1.31 m | 1.47 m |
| Purton Stoke | River Key | 7.1 km | 1.89 m | 2.34 m |
| Water Eaton | River Ray | 8.6 km | 1.90 m | 2.68 m |
Live levels, predictions and rain-response behaviour are on each gauge's page and in the property report.
| Overflow | Discharges into | Distance | Spills | Hours |
|---|---|---|---|---|
| Cirencester Wwtw | Shorncote Ditch | 1.4 km | 125 (2025) | 2,067 |
| Station Road Sewage Pumping Station | Unnamed Trib Of Derry Brook | 4.8 km | 22 (2025) | 171 |
Official annual EDM figures — a water-quality signal for local watercourses, not a property flood-risk factor.
10 mapped flood-defence assets within 500 m — nearest ~14 m (natural high ground). Defences reduce risk, never remove it.
The interactive flood-risk map with a building picker (your exact house, not the postcode), the 2050s climate view, surface-water and planning flood zones at your building, exact recorded-flood distances, year-by-year warning charts, watercourses including culverted streams, an insurance outlook with the Flood Re rules, and a printable document with every dataset receipt — start with the free preview, unlock for £19.
Flooded here before? Log it and see what your floods had in common.
At-risk postcodes near SN6 6QT — all in the SN6 district.
© Environment Agency copyright and/or database right 2025. All rights reserved. Some features of this map are based on digital spatial data from the Centre for Ecology & Hydrology, © NERC (CEH). © Crown Copyright and Database Rights 2025 OS AC0000807064. This product is produced in part from PAF® and Multiple Residence Data, the copyright in which is owned by Royal Mail Group Limited and/or Royal Mail Group plc. All rights reserved. Licence number AC0000807064. Recorded Flood Outlines and warning history © Environment Agency copyright and/or database right 2025. Storm-overflow figures: EA Event Duration Monitoring (England); live overflow status © the water companies, incl. Dŵr Cymru Welsh Water and Scottish Water. Flood defences © Environment Agency (OGL v3). This page summarises public area-level data — it is not a flood-risk survey and not a substitute for the official GOV.UK service. All data sources & licences. More postcodes: the SN6 district.