 FloodRadar
Log inCreate free account
FloodRadar
Log inCreate free account
FloodRadar
Log inCreate free account
FloodRadar
Log inCreate free account
Up to Low likelihood
Properties in B11 2LA sit in the Environment Agency's Low flood-likelihood band (worst property). The band is the worst found in the postcode — it describes the land around properties (defence-adjusted, rivers & sea), not any single address, and not today's conditions.
| Likelihood band | Annual chance | Properties | Of which homes |
|---|---|---|---|
| High | greater than 3.3% | 0 | 0 |
| Medium | 1% – 3.3% | 0 | 0 |
| Low | 0.1% – 1% | 2 | 0 |
| Very low | below 0.1% | 0 | 0 |
Over a 25-year mortgage, a property in a low-likelihood area has a 2–22% chance of flooding at least once.
B11 2LA gets about 789 mm of rain a year on average (wettest month November, 78 mm; driest March, 53 mm). That is 32% drier than the UK as a whole, which averages 1,163 mm a year.
A thirty-year average for the surrounding area, not a measurement at this address and not a flood risk on its own: a dry area floods when a storm sits over it, and a wet one may drain away perfectly well. Source: Met Office HadUK-Grid 1991–2020 (5 km grid), 3.0 km away. Average rainfall: HadUK-Grid v1.3.2, Met Office. Contains public sector information licensed under the Open Government Licence v3.0.
The ground here sits at about 111 m above sea level and falls 20 m across the surrounding 800 m. Surface water reaching this point runs off ground lying to the west-south-west, 6.1 m higher.

The nearest watercourse on the river map is the River Cole, about 140 m from the centre of B11 2LA. It flows into the River Blythe about 20 km downstream.
A gauge downstream shows water that has already passed this point; one upstream sees it first. Distances along the river are from the point on the River Cole nearest the centre of B11 2LA. From Ordnance Survey’s river map (OS Open Rivers), which leaves out small streams, ditches and culverts, so a nearer one may exist. This describes where water goes on the map; it says nothing about flooding at any address. Contains OS data © Crown copyright and database rights 2026.
Because properties in the low likelihood band; 540 official warnings since 2006.



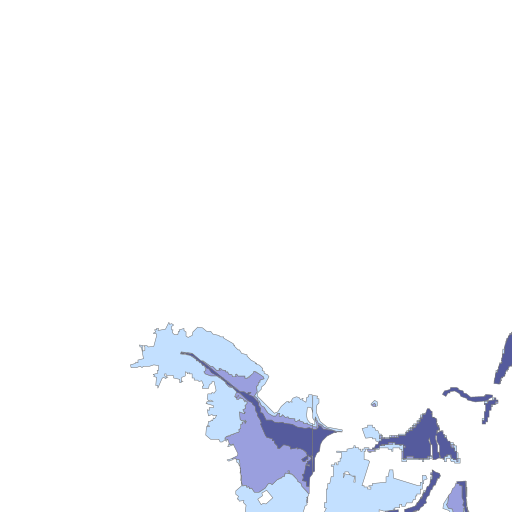




The map above shows the real EA rivers & sea likelihood cells around B11 2LA. The small panels are illustrative previews of the report's per-layer map views — the full report draws each layer for real, plus recorded extents, defences and a building picker on an interactive map.
Warnings cover flood areas, not individual addresses.
None mapped within ~1 km of this postcode's centre.
No recorded outline near this postcode means no flood was mapped here, which is not evidence none happened: the Environment Agency mapped only some floods, mapping effort rose sharply after about 2000, and surface-water flooding is largely absent from this record. The full report tests every other flood source at the exact building.
Babet (2023, 17 warnings nearby) ▶ replay it here · Dennis (2020, 10 warnings nearby) ▶ replay it here · Henk (2024, 7 warnings nearby) ▶ replay it here · Darragh (2024, 6 warnings nearby) ▶ replay it here
| Gauge | River | Distance | Typical high | Highest on record |
|---|---|---|---|---|
| Calthorpe Park | River Rea | 3.0 km | 0.42 m | 2.50 m |
| Selly Park | River Rea | 4.7 km | 1.10 m | 1.82 m |
| Solihull Lodge | River Cole | 6.5 km | 0.42 m | 1.93 m |
| Brookvale Road | River Tame | 6.9 km | 2.00 m | 3.65 m |
Live levels, predictions and rain-response behaviour are on each gauge's page and in the property report.
| Overflow | Discharges into | Distance | Spills | Hours |
|---|---|---|---|---|
| Sports Ground Cso | Spark Brook | 0.2 km | 10 (2024) | 9 |
| Cole Valley Wo Sewer (point D) Cso | River Cole | 0.3 km | 0 (2024) | 0 |
| Small Heath - Heybarnes Rd (cso) | River Cole | 0.3 km | 0 (2024) | 0 |
| Hay Hall Road Cso | River Cole | 0.5 km | 29 (2024) | 76 |
Official annual EDM figures — a water-quality signal for local watercourses, not a property flood-risk factor.
17 mapped flood-defence assets within 500 m — nearest ~123 m (natural high ground). Defences reduce risk, never remove it.
The interactive flood-risk map with a building picker (your exact house, not the postcode), the 2050s climate view, surface-water and planning flood zones at your building, exact recorded-flood distances, year-by-year warning charts, watercourses including culverted streams, an insurance outlook with the Flood Re rules, and a printable document with every dataset receipt — start with the free preview, unlock for £19.
Flooded here before? Log it and see what your floods had in common.
At-risk postcodes near B11 2LA — all in the B11 district.
© Environment Agency copyright and/or database right 2025. All rights reserved. Some features of this map are based on digital spatial data from the Centre for Ecology & Hydrology, © NERC (CEH). © Crown Copyright and Database Rights 2025 OS AC0000807064. This product is produced in part from PAF® and Multiple Residence Data, the copyright in which is owned by Royal Mail Group Limited and/or Royal Mail Group plc. All rights reserved. Licence number AC0000807064. Place names: Contains OS data © Crown copyright and database rights 2026. Contains Royal Mail data © Royal Mail copyright and database right 2026. Contains National Statistics data © Crown copyright and database right 2026. Licensed under the Open Government Licence v3.0. Recorded Flood Outlines and warning history © Environment Agency copyright and/or database right 2025. Storm-overflow figures: EA Event Duration Monitoring (England); live overflow status © the water companies, incl. Dŵr Cymru Welsh Water and Scottish Water. Flood defences © Environment Agency (OGL v3). This page summarises public area-level data — it is not a flood-risk survey and not a substitute for the official GOV.UK service. All data sources & licences. More postcodes: the B11 district.