← Back
0.13

Thirlmere

St Johns Beck
Derwent West Cumbria and Duddon catchment • Legburthwaite • Cumberland • ID: 750605 • Level
(31m ago) • 3 readings/hr • 100 views

Set water level alerts

Get notified about Thirlmere — tick as many as you like, they all share the notify settings below.

Unusual rise FloodRadar+Top 1% rise rate for this gauge.
Drag the line on the chart, or type a value: m
Quick pick:

Each one is saved as its own alert — pause or remove them individually any time.

Not an emergency service — if in danger call 999. Alerts rely on EA/SEPA data and are best-efforts. Terms

Current Level
0.131 m
▬ Steady
24h Max
0.131 m
24h Min
0.130 m
Typical Range
0.11 - 1.00
m
Highest Recorded
3.26 m
5 Dec 2015
Since Jan 1976
Current level is 4% of this
🚽 Sewage overflows nearby

Recent Water Levels

🌍 floodradar.co.uk
1 day

Recent Readings

Steady over 6h
23 Aug 23:15 ▬ steady 0.131 m
23 Aug 23:00 ▬ steady 0.131 m
23 Aug 22:45 ▬ steady 0.131 m
23 Aug 21:30 ▬ steady 0.131 m
23 Aug 21:15 ▬ steady 0.131 m
23 Aug 21:00 ▬ steady 0.131 m
23 Aug 20:45 ▬ steady 0.131 m
23 Aug 20:30 ▬ steady 0.131 m
23 Aug 20:15 ▬ steady 0.131 m
23 Aug 20:00 ▬ steady 0.131 m
23 Aug 19:45 ▬ steady 0.131 m
23 Aug 19:30 ▬ steady 0.131 m
23 Aug 19:15 ▬ steady 0.131 m
23 Aug 19:00 ▬ steady 0.131 m
23 Aug 18:45 ▬ steady 0.131 m
23 Aug 18:30 ▬ steady 0.131 m
23 Aug 18:15 ▬ steady 0.131 m
23 Aug 18:00 ▲ +0.1 cm 0.131 m
23 Aug 17:45 ▬ steady 0.130 m
23 Aug 17:30 0.130 m

Rainfall & Weather

Loading rainfall and weather data...

Flood history near this gauge

Official Environment Agency warnings issued since 2008 for the 15 flood areas linked to this gauge (nearest 5.5 km away).

11severe warnings 206flood warnings 350flood alerts

Most recent flood warning: 28 Feb 2026Keswick Campsite

Year by year
YearSevereWarningsAlerts
2026 0 3 19
2025 0 10 20
2024 0 9 20
2023 0 15 17
2022 0 8 14
2021 0 13 17
2020 0 22 15
2019 0 14 20
2018 0 6 10
2017 0 10 21
2016 0 6 16
2015 11 27 24
2014 0 7 13
2013 0 5 16
2012 0 8 20
2011 0 9 16
2010 0 8 14
2009 0 15 24
2008 0 11 34

Warnings apply to a whole flood area, not necessarily this exact spot. Years before 2006 aren't covered by the EA's historic record. See also the Legburthwaite flood history.

Nearby Stations

Loading nearby stations...

Station Details

  • Monitoring Station: Thirlmere
  • Watercourse: St Johns Beck
  • Nearest Town: Legburthwaite
  • County: Cumberland
  • Coordinates: 54°33'57"N 3°3'49"W (54.565937, -3.063696)
  • Open in: Google Maps · Apple Maps (opens your maps app)
  • Date Opened: 1 Jan 1975
  • Status: Active
  • Station Type: River level station
  • Station Reference: 750605
  • EA Gauge ID: 750605-level-stage-i-15_min-m
  • Parameter: Level
  • Unit: m
  • Typical rise rate: 1 cm/hr (p95 sustained over 90 days)
  • Typical data delay: ~22 min (measured reading→publication lag)
  • Tidal: No
  • Lock / structure: No
  • Catchment Area: Derwent West Cumbria and Duddon
  • Typical Range: 0.110 – 1.000 m
  • Drainage Area: 42 km² upstream of this gauge
  • Flow Data: Available (m³/s) via EA Hydrology
  • EA Cross-check: 0.13 m (EA at 23 Aug 23:15)
  • Flow Archive: National River Flow Archive ↗

Geographic coordinates may reflect the access point for the gauge, and not the precise location in the watercourse that it is taking readings from.

Catchment Character

🌊 Steep & flashy Steep catchment sheds rain quickly — expect fast, sharp rises after heavy rain.

Your catchment is all the land that drains rainfall into the river above this gauge. Its character — how steep, wet, wooded, urban or chalky that land is — decides how fast rain here turns into a rising river. A steep, bare or clay catchment is “flashy” (rises and falls quickly, floods easily); a flat, chalk or well-wooded one is slow and steady. The tiles below put numbers to that; the flow-duration curve reads left-to-right from the river’s typical high flows (Q5) down to its low flows (Q95) — a steep curve means a flashy river.

The physical character of the land that drains to this gauge, and how it shapes its flood response — from the National River Flow Archive (UKCEH).
Baseflow Index
0.38
mixed response
Avg Annual Rainfall
2,900 mm/yr
1991–2020 · +8% since 1941–70
Urban Extent
0.0%
largely rural
Median Annual Flood
20.20 m³/s
QMED — typical yearly peak flow
Highest Recorded Flow
97.96 m³/s
5 Dec 2015
Flow-Duration Curve
mean 0.8573.850.2160.1595% (high)% of days exceeded95% (low)
Daily flow (m³/s) exceeded each % of the time — a steep curve is flashy, a flat one is steady. Q5 high · Q50 median · Q95 low.
Land Cover (2023)
Woodland 13%Grassland 73%Heath/scrub 5%Other 8%
Grassland 66% → 73% since 1990

Flow affected by: surface-water abstraction, public water supply.

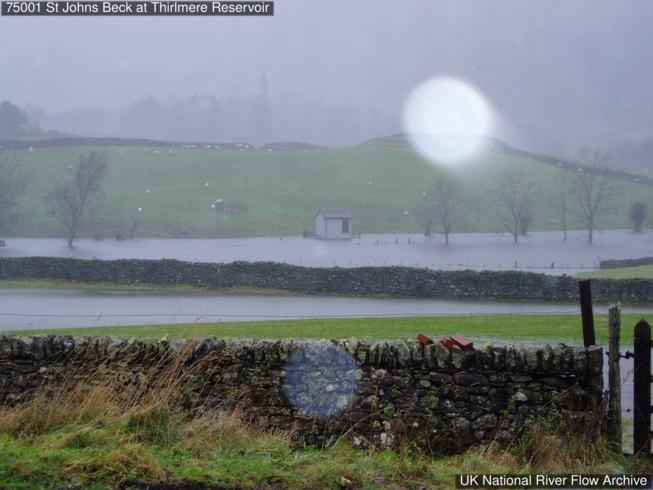
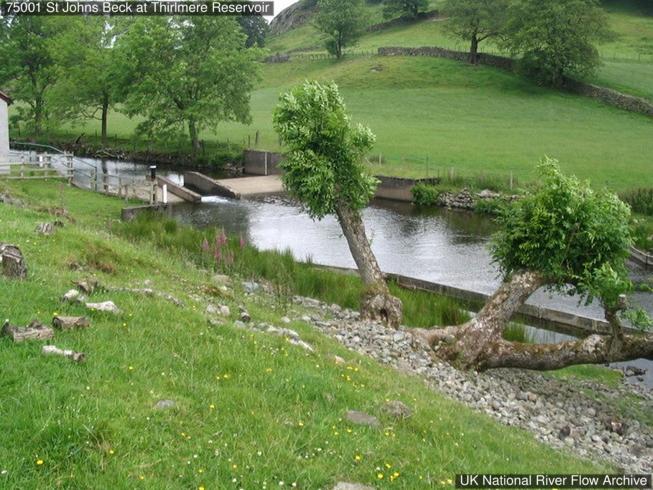
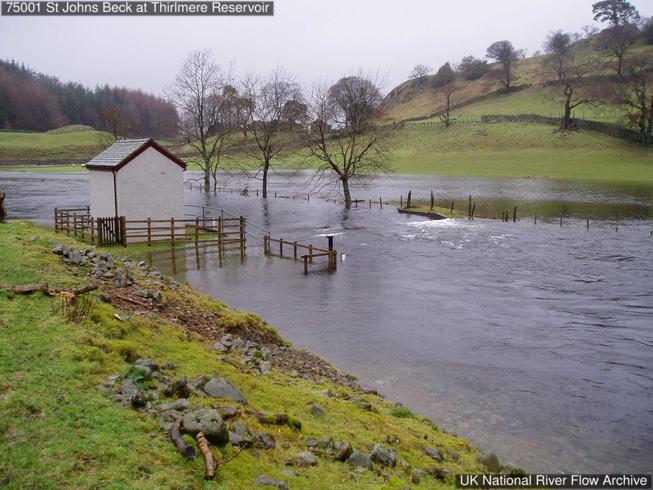
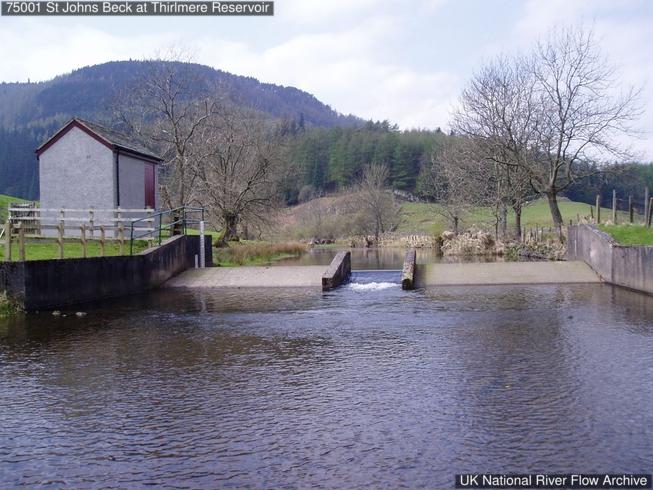
Photos

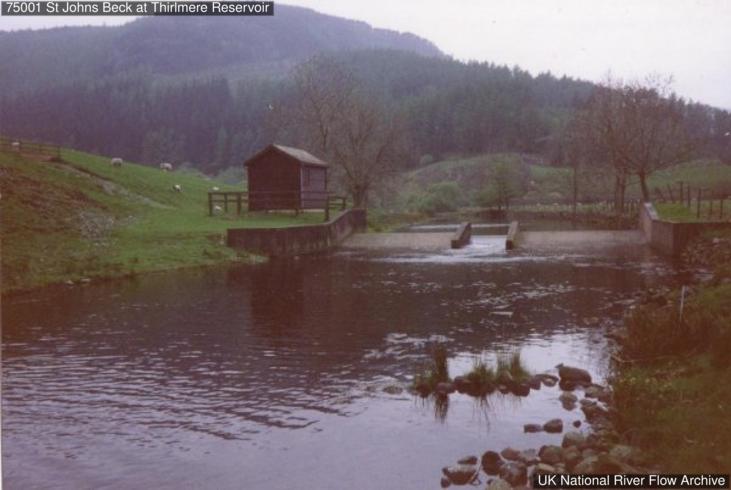
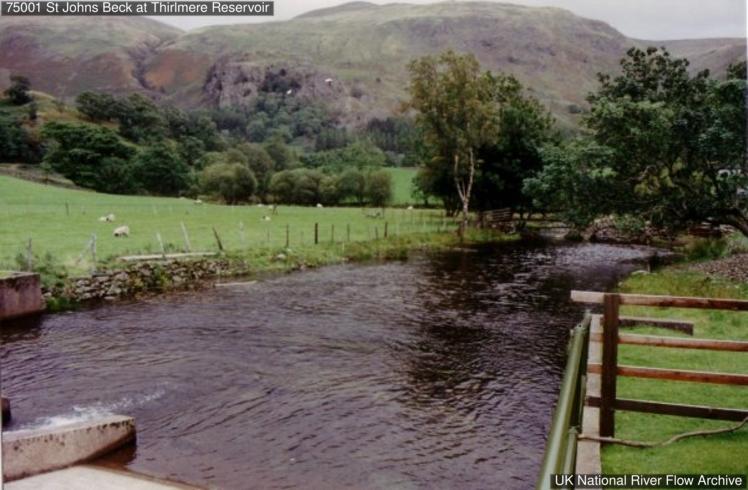
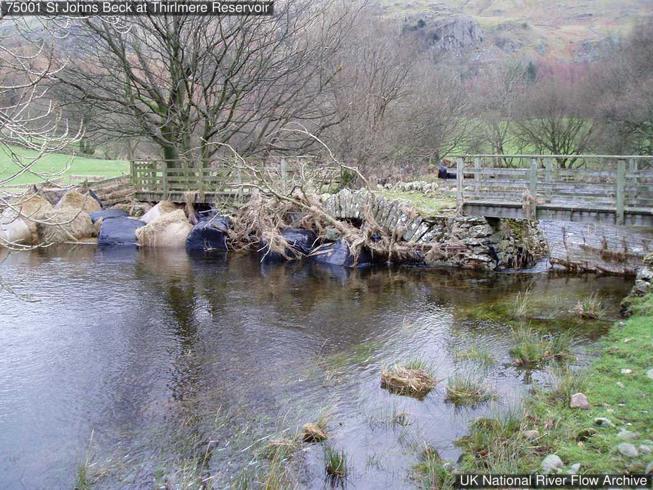
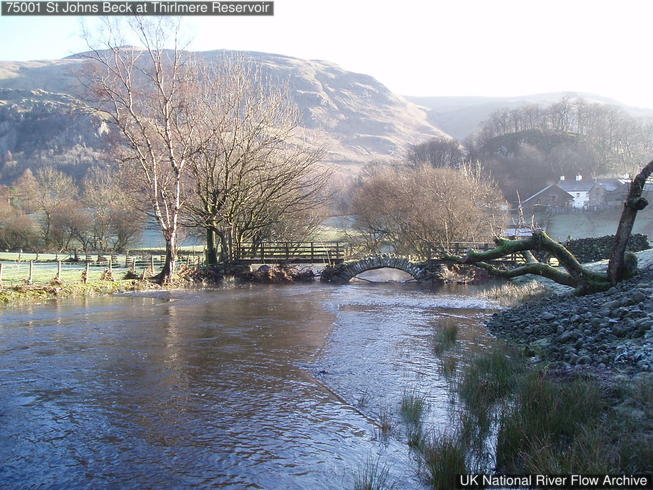
Gauging-station photographs from the National River Flow Archive (UKCEH).

Photos © NRFA / UKCEH & the measuring authority — shown at web resolution. Full gallery on the NRFA ↗

About this gauge

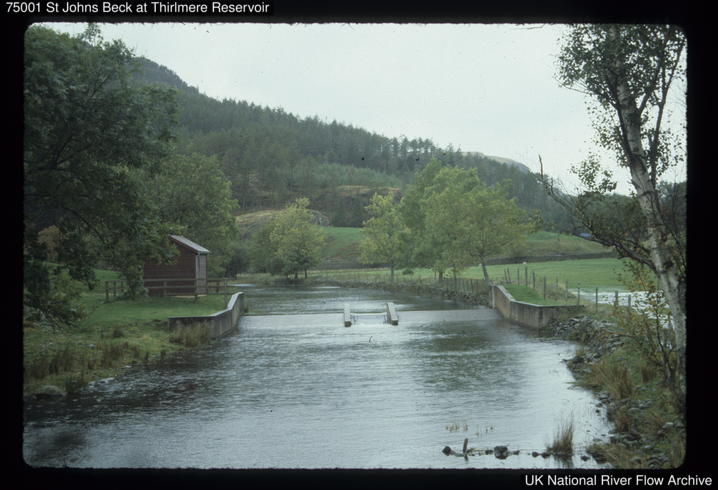
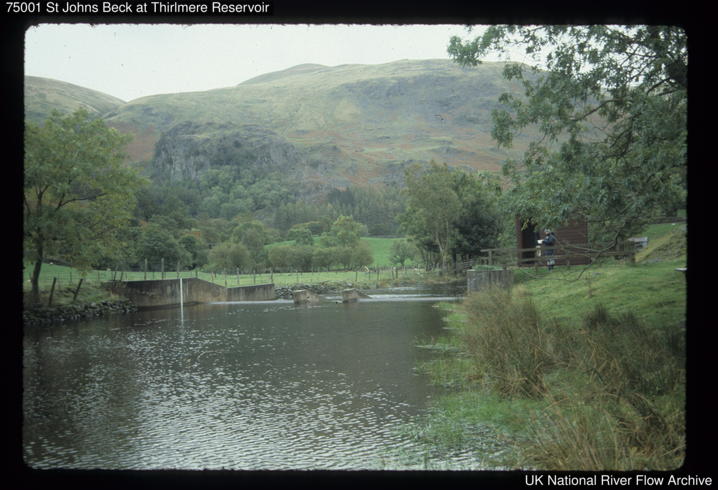
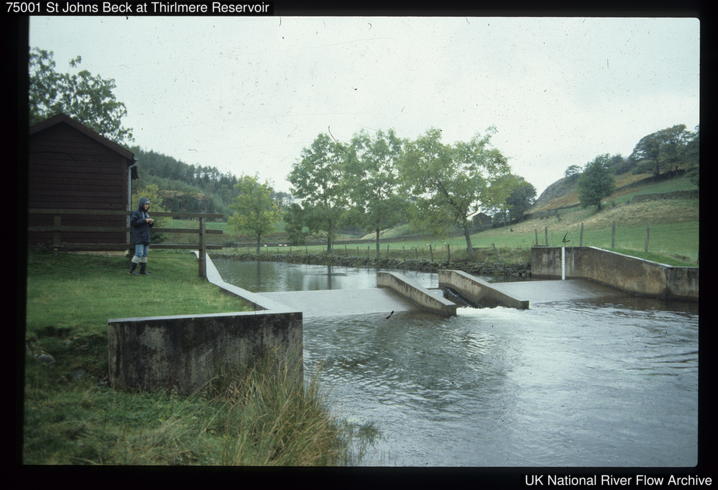
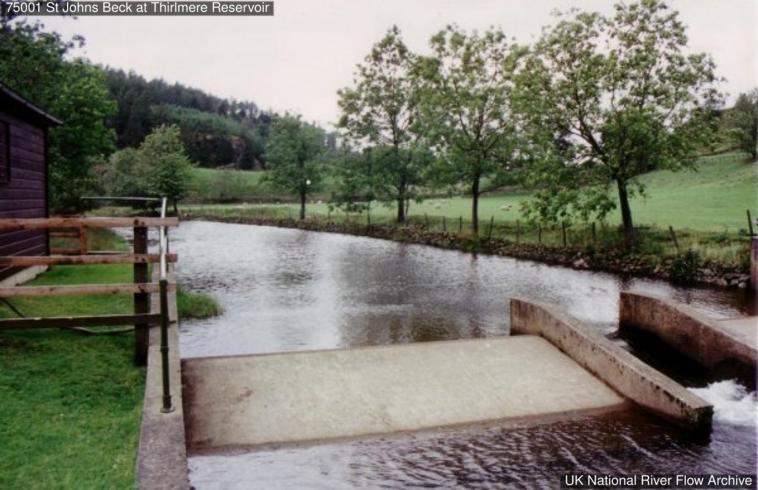
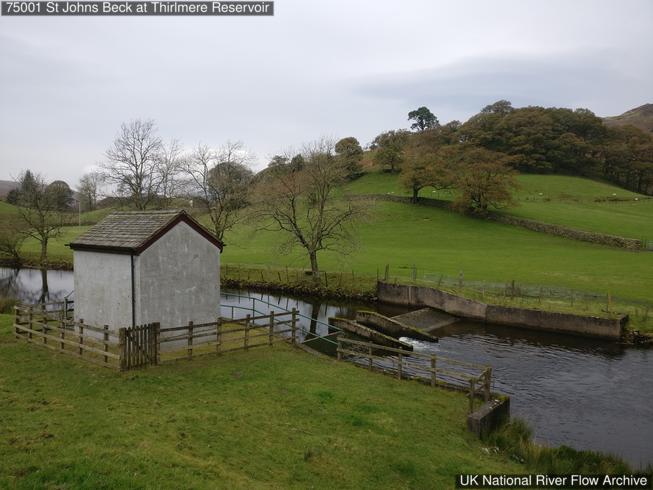
Compound Crump weir gauging the compensation and flood discharges from Thirlmere reservoir.

More detail

The catchment

Catchment composed entirely of impervious Ordovician Borrowdale Volcanics, runoff from these into the reservoir is rapid. Rock outcrop, rough pasture with heather. Sheep grazing, some forestry.

The station

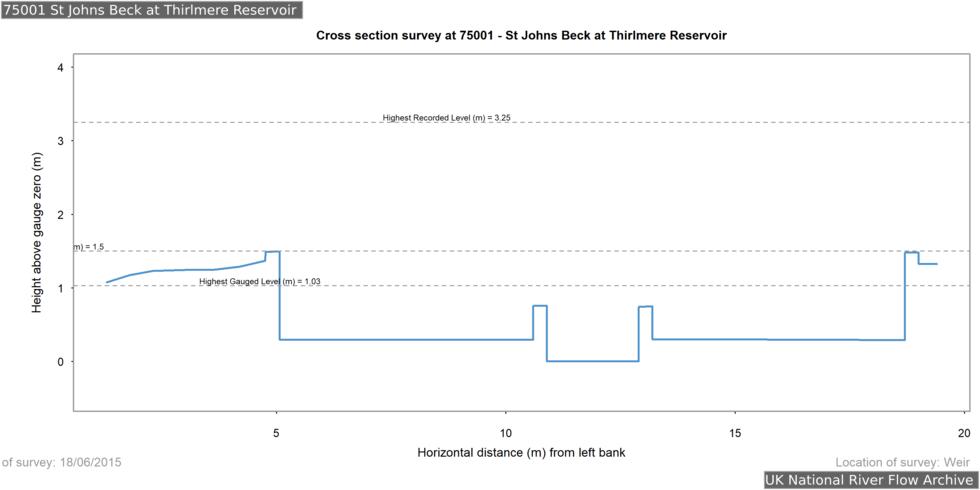
Compound Crump profile weir, 13.6m wide overall, central notch 1.96m wide and 0.31m lower than flanking crests, each 5.5m wide. Station building raised above flood level in 2001. Station measures compensation and flood spill discharges from Thirlmere reservoir approx. 1km upstream. Replaced a rectangular thin-plate weir in January 1973.

How it measures flow

Modular limit 0.7m (centre crest), 0.8m (side crests), 1.04m (full structure). Station is bypassed on both banks at high flows, with significant out of bank flow at the highest flows. The bridge downstream can be blocked by debris, backing-up the weir. During the 2005 event the bridge was almost totally blocked with debris causing a significant rise in levels. The highest flows have been compared with the spillweir (Thirlmere Dam Wall) at Thirlmere Reservoir. Rating from theory and check gaugings to 1m, above this from weir equations at Thirlmere Dam Wall and stage-stage relationship between the two stations. More high flow gaugings necessary to confirm or improve the rating which is understood to underestimate significant bypass flow.

Flow regime

Flow pattern reflects heavy abstraction, compensation flows and flood spill discharges of Thirlmere 1km upstream. Natural water level of Thirlmere was raised 17m by impounding dam at beginning of 20th Century. Abstractions from Thirlmere Reservoir for Manchester, pumped from Dunmail Raise. Catchwater channel diverts streams from Mill Gill to Helvellyn Gill into Thirlmere Reservoir at all but highest flows.

The flow record

Daily mean flow record begins in 1935 and is missing from 1937-45, 1968-69 and 1970-72. Naturalised monthly flows 1964-1966. Confidence in the flow record before the installation of the compound Crump weir in 1973 is low.

Descriptions from the National River Flow Archive (UKCEH). NRFA station record ↗

Gauge Details

How this gauging station is built and how long it has measured (NRFA / UKCEH).

Gauge type
Gauging structure
Operating since
1935
Station datum
159.5 mAOD
Flow record
1935–2024 · 89 yrs · 87% complete
Peak-flow record
since 1973
Hydrometric area
75
Measured by
Environment Agency

Frequently asked questions

Is the St Johns Beck at Thirlmere flooding today?

The current level is 0.13m, which is within the typical range of 0.11 to 1.00m. Flooding is unlikely at this level.

Is the river level rising or falling at Thirlmere?

Based on the most recent readings, the level is currently steady. The chart above shows the last 7 days of measurements, updated roughly every 15 minutes.

What is a normal level for the St Johns Beck at Thirlmere?

The typical range at this station is 0.11m to 1.00m, based on Environment Agency historical data. Levels above 1.00m are higher than usually seen and may indicate a flood risk.

How often is this river level data updated?

Readings are taken by the Environment Agency gauge roughly every 15 minutes and FloodRadar refreshes its data continuously, so the level shown is normally less than an hour old.

Embed this gauge on your website

Free live river-level widget — ideal for parish councils, angling clubs and local sites. Updates automatically.

Preview

📮 Flood risk by postcode near this gauge

Postcodes within 5 km with properties in the Environment Agency’s rivers-and-sea flood-risk bands:

Check any UK postcode’s flood risk →

🏠 Buying or renting around here? Get the Property Flood-Risk Report for any English postcode — official risk band, floods since 1946, warning history, river behaviour and nearby storm overflows. £19 one-off. Learn more →