Tame Anker and Mease catchment
• Branston • Staffordshire • ID: 4019 • Level
(34m ago) • 3 readings/hr • 153 views
Set water level alerts
Get notified about Drakelow — tick as many as you like, they all share the notify settings below.
Alert me when (tick one or more)
⤴Unusual rise — FloodRadar+Top 1% rise rate for this gauge.
Height for "Above a height"
Drag the line on the chart, or type a value:mASD
Quick pick:
You'll be notified when this gauge is rising more than 0.10 mASD/hr — a sign of rapidly increasing water levels.
You'll be notified when a new storm-overflow (sewage) discharge starts within ~3 km of this gauge, based on the water companies' near-real-time feeds.
Notify by (tick one or more)
Your browser will ask permission, then you'll get a notification even when FloodRadar isn't open.
On iPhone: tap Share → Add to Home Screen first, then open it from there and set the alert.
Each one is saved as its own alert — pause or remove them individually any time.
Not an emergency service — if in danger call 999. Alerts rely on
EA/SEPA data and are best-efforts. Terms
Current Level
1.155 mASD
▼ Falling
24h Max
1.312 mASD
24h Min
1.155 mASD
Typical Range
1.02 - 2.04
mASD
Highest Recorded
3.88 mASD
4 Jan 2024
Since May 1959
Current level is 30% of this
🚽Sewage overflows nearby
Recent Water Levels
🌍 floodradar.co.uk
1 day
Prediction V2
Prediction Eris
Nimbus beta
Experimental model fusing soil moisture, river flow, groundwater and catchment
character. Shown with its calibrated 10–90% confidence band. Under evaluation —
not yet promoted, so treat as a second opinion.
Long Term
🌍 floodradar.co.uk
—
Consecutive rainy days0 → 10+
Days Above Normal
This year vs 5-year monthly range
Recent Readings
Falling · -4 cm over 6h
23 Aug 23:15▼ -0.2 cm1.155 mASD
23 Aug 23:00▼ -0.2 cm1.157 mASD
23 Aug 22:45▼ -0.8 cm1.159 mASD
23 Aug 21:30▼ -0.2 cm1.167 mASD
23 Aug 21:15▼ -0.2 cm1.169 mASD
23 Aug 21:00▬ steady1.171 mASD
23 Aug 20:45▼ -0.2 cm1.171 mASD
23 Aug 20:30▬ steady1.173 mASD
23 Aug 20:15▼ -0.1 cm1.174 mASD
23 Aug 20:00▼ -0.3 cm1.175 mASD
23 Aug 19:45▼ -0.1 cm1.178 mASD
23 Aug 19:30▼ -0.2 cm1.179 mASD
23 Aug 19:15▼ -0.2 cm1.181 mASD
23 Aug 19:00▬ steady1.183 mASD
23 Aug 18:45▼ -0.2 cm1.184 mASD
23 Aug 18:30▼ -0.2 cm1.186 mASD
23 Aug 18:15▼ -0.1 cm1.188 mASD
23 Aug 18:00▬ steady1.189 mASD
23 Aug 17:45▼ -0.2 cm1.190 mASD
23 Aug 17:301.192 mASD
Rainfall & Weather
Loading rainfall and weather data...
Flood history near this gauge
Official Environment Agency warnings issued since 2007 for the 10 flood
areas linked to this gauge (nearest 2.6 km away).
Warnings apply to a whole flood area, not necessarily this exact spot. Years before 2006 aren't covered by the EA's historic record.
See also the Branston flood history.
Geographic coordinates may reflect the access point for the gauge, and not the precise location in the watercourse that it is taking readings from.
Catchment Character
🌊 Urban & flashyHeavily built-up — rain runs off hard surfaces fast, so levels can spike within hours of heavy rain.
Your catchment is all the land that drains rainfall into the river above this gauge. Its character — how
steep, wet, wooded, urban or chalky that land is — decides how fast rain here turns into a rising river. A steep, bare or clay
catchment is “flashy” (rises and falls quickly, floods easily); a flat, chalk or well-wooded one is
slow and steady. The tiles below put numbers to that; the flow-duration curve reads left-to-right
from the river’s typical high flows (Q5) down to its low flows (Q95) — a steep curve means a flashy river.
The physical character of the land that drains to this gauge, and how it shapes its flood response — from the National River Flow Archive (UKCEH).
Baseflow Index
0.51
mixed response
Avg Annual Rainfall
745 mm/yr
1991–2020 · +3% since 1941–70
Urban Extent
15%
heavily urbanised
Median Annual Flood
174 m³/s
QMED — typical yearly peak flow
Highest Recorded Flow
351 m³/s
7 Nov 2000
Flow-Duration Curve
Daily flow (m³/s) exceeded each % of the time — a steep curve is flashy, a flat one is steady. Q5 high · Q50 median · Q95 low.
Velocity area station with complex rating history owing to river regrading in 1965 and 1973 draining a very large catchment that contains urban and industrial land use.
More detail
The catchment
Very large catchment. Small areas of Coal Measures in the Stoke area. Approx 25% of the catchment is overlain by Boulder Clay and 10% by valley gravel, terraces and alluvium. Drift free areas mostly Triassic Mudstones and Triassic and Permian Sandstones. A large area of the catchment is urban with large urban industrial areas, otherwise, the main land use is mixed farming.
The station
Velocity area station. The left bank is a low lying golf course that is inundated from 2.68mASD. Cableway removed in 2014 - flow gaugings still performed in old cableway section.
How it measures flow
Complex rating history owing to river re-grading (1965 and 1973). Multiple peak flow ratings, particularly since 2001. High flow precision limited by ungauged flow over the left bank. Much storage in valley gravels. A number of gaugings have been taken to assess out of bank flows; on 1/11/2000 gaugings taken at 3.216mASD showed floodplain flow to be 26% of the total flow of 252m3/s. Extreme high flow gaugings carried out across the floodplain and main river section in Burton-upon-Trent, from St. Peters Bridge using a remote controlled ADCP. In-channel weed growth at the station can affect low and medium flow gaugings.
Flow regime
Flows substantially modified, particularly by imports into the Tame system.
The flow record
Summer flows reprocessed in 2010 for the period 2006-2010 to account for weed growth. 2011 flows reprocessed to account for severe weed growth. Full period of record peak flow data reviewed and released in October 2018 (WINFAP Files v7). The majority of low flows (~<15 m3/s) between 16 July - 30 September 2018 are flagged as suspect.
How this gauging station is built and how long it has measured (NRFA / UKCEH).
Gauge type
Velocity–area
Operating since
1966
Station datum
43.0 mAOD
Flow record
1966–2024 · 58 yrs · 100% complete
Peak-flow record
since 1959
Hydrometric area
28
Measured by
Environment Agency
Nearby Groundwater
Soil Moisture
Possible storm-overflow correlation
🚽 Storm overflows on this river
Frequently asked questions
Is the River Trent at Drakelow flooding today?
The current level is 1.16m, which is within the typical range of 1.02 to 2.04m. Flooding is unlikely at this level.
Is the river level rising or falling at Drakelow?
Based on the most recent readings, the level is currently falling. The chart above shows the last 7 days of measurements, updated roughly every 15 minutes.
What is a normal level for the River Trent at Drakelow?
The typical range at this station is 1.02m to 2.04m, based on Environment Agency historical data. Levels above 2.04m are higher than usually seen and may indicate a flood risk.
How often is this river level data updated?
Readings are taken by the Environment Agency gauge roughly every 15 minutes and FloodRadar refreshes its data continuously, so the level shown is normally less than an hour old.
Embed this gauge on your website
Free live river-level widget — ideal for parish councils, angling clubs and local sites. Updates automatically.
Preview
📮 Flood risk by postcode near this gauge
Postcodes within 5 km with properties in the Environment Agency’s rivers-and-sea flood-risk bands:
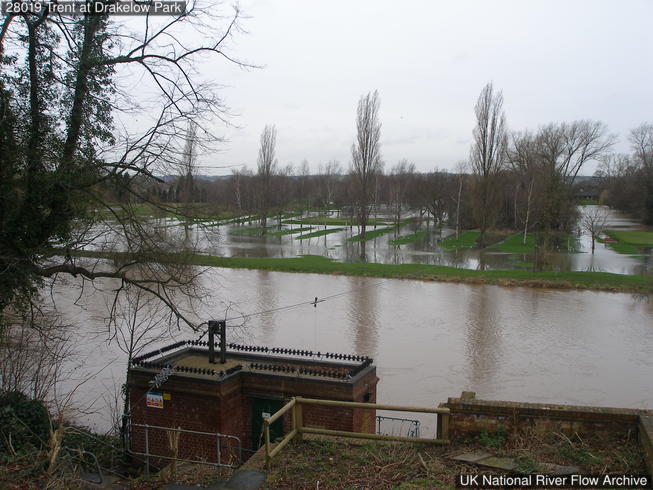 5 Mar 2007 Measuring section during high flows with out of bank flow in golf course on opposite bank to gauging station
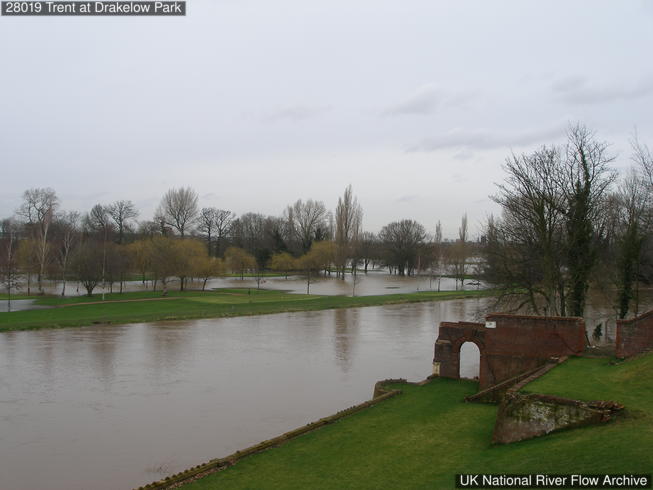 5 Mar 2007 Downstream section at high flows
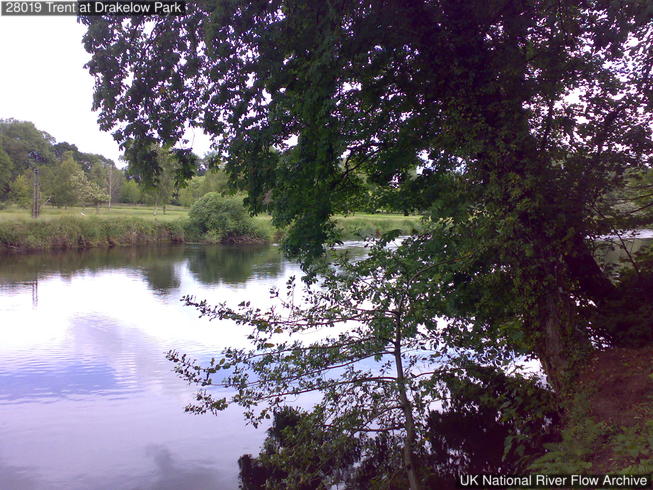 Looking downstream from station
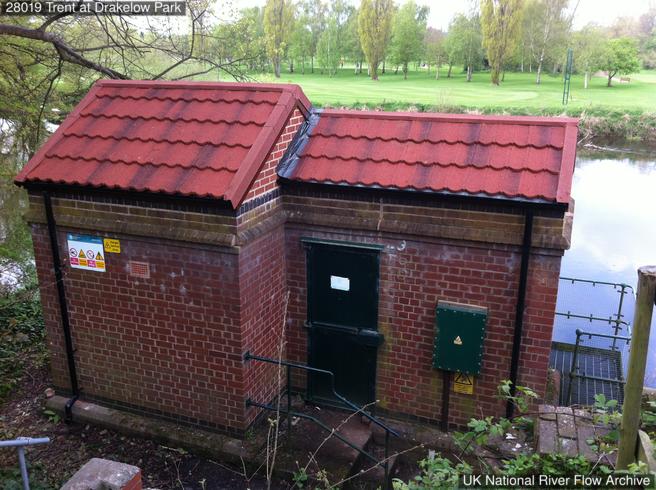 Station hut
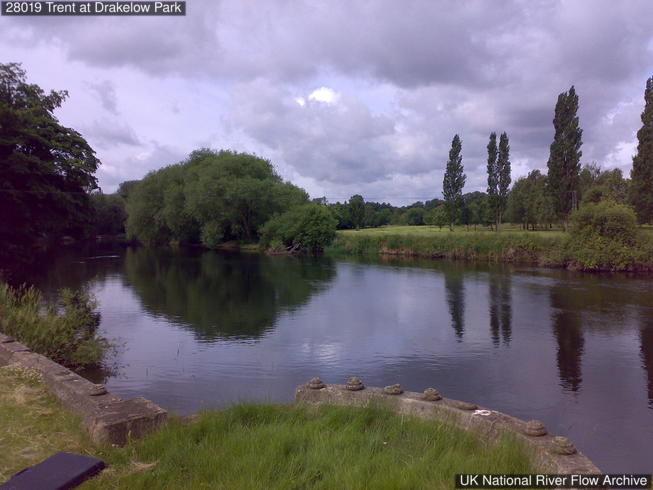 Looking upstream from station