Get notified about Hamstall Ridware — tick as many as you like, they all share the notify settings below.
Alert me when (tick one or more)
⤴Unusual rise — FloodRadar+Top 1% rise rate for this gauge.
Height for "Above a height"
Drag the line on the chart, or type a value:mASD
Quick pick:
You'll be notified when this gauge is rising more than 0.10 mASD/hr — a sign of rapidly increasing water levels.
You'll be notified when a new storm-overflow (sewage) discharge starts within ~3 km of this gauge, based on the water companies' near-real-time feeds.
Notify by (tick one or more)
Your browser will ask permission, then you'll get a notification even when FloodRadar isn't open.
On iPhone: tap Share → Add to Home Screen first, then open it from there and set the alert.
Each one is saved as its own alert — pause or remove them individually any time.
Not an emergency service — if in danger call 999. Alerts rely on
EA/SEPA data and are best-efforts. Terms
Current Level
0.107 mASD
▬ Steady
24h Max
0.115 mASD
24h Min
0.104 mASD
Typical Range
0.10 - 0.80
mASD
Highest Recorded
1.52 mASD
25 Apr 1971
Since Jan 1960
Current level is 7% of this
🚽Sewage overflows nearby
Recent Water Levels
🌍 floodradar.co.uk
1 day
Prediction V2
Prediction Eris
Nimbus beta
Experimental model fusing soil moisture, river flow, groundwater and catchment
character. Shown with its calibrated 10–90% confidence band. Under evaluation —
not yet promoted, so treat as a second opinion.
River Flow
90 days
Daily mean discharge (m³/s) with the daily min–max band, from the EA Hydrology API. Flow is the volume of water passing the gauge — often a more direct flood signal than level.
Long Term
🌍 floodradar.co.uk
—
Consecutive rainy days0 → 10+
Days Above Normal
This year vs 5-year monthly range
Recent Readings
Rising · +0.2 cm over 6h
23 Aug 23:15▲ +0.1 cm0.107 mASD
23 Aug 23:00▬ steady0.106 mASD
23 Aug 22:45▲ +0.1 cm0.106 mASD
23 Aug 21:30▬ steady0.105 mASD
23 Aug 21:15▬ steady0.105 mASD
23 Aug 21:00▬ steady0.105 mASD
23 Aug 20:45▬ steady0.105 mASD
23 Aug 20:30▬ steady0.105 mASD
23 Aug 20:15▲ +0.1 cm0.105 mASD
23 Aug 20:00▬ steady0.104 mASD
23 Aug 19:45▬ steady0.104 mASD
23 Aug 19:30▬ steady0.104 mASD
23 Aug 19:15▬ steady0.104 mASD
23 Aug 19:00▬ steady0.104 mASD
23 Aug 18:45▬ steady0.104 mASD
23 Aug 18:30▬ steady0.104 mASD
23 Aug 18:15▼ -0.1 cm0.104 mASD
23 Aug 18:00▬ steady0.105 mASD
23 Aug 17:45▬ steady0.105 mASD
23 Aug 17:300.105 mASD
Rainfall & Weather
Loading rainfall and weather data...
Flood history near this gauge
Official Environment Agency warnings issued since 2007 for the 10 flood
areas linked to this gauge (nearest 2.5 km away).
Warnings apply to a whole flood area, not necessarily this exact spot. Years before 2006 aren't covered by the EA's historic record.
See also the Hamstall Ridware flood history.
Geographic coordinates may reflect the access point for the gauge, and not the precise location in the watercourse that it is taking readings from.
Catchment Character
🌊 Fairly flashyResponds fairly quickly to rain, with moderate baseflow between events.
Your catchment is all the land that drains rainfall into the river above this gauge. Its character — how
steep, wet, wooded, urban or chalky that land is — decides how fast rain here turns into a rising river. A steep, bare or clay
catchment is “flashy” (rises and falls quickly, floods easily); a flat, chalk or well-wooded one is
slow and steady. The tiles below put numbers to that; the flow-duration curve reads left-to-right
from the river’s typical high flows (Q5) down to its low flows (Q95) — a steep curve means a flashy river.
The physical character of the land that drains to this gauge, and how it shapes its flood response — from the National River Flow Archive (UKCEH).
Baseflow Index
0.46
mixed response
Avg Annual Rainfall
811 mm/yr
1991–2020 · +4% since 1941–70
Urban Extent
2.7%
largely rural
Median Annual Flood
17.52 m³/s
QMED — typical yearly peak flow
Highest Recorded Flow
38.74 m³/s
17 Mar 1947
Flow-Duration Curve
Daily flow (m³/s) exceeded each % of the time — a steep curve is flashy, a flat one is steady. Q5 high · Q50 median · Q95 low.
Non-standard broad crested weir by-passed at high flows but providing accurate flows at lower levels - replaced a side contracted flume in 1994. Heavily influenced by Blithfield reservoir.
More detail
The catchment
Catchment mainly drains Keuper Marl and subordinate sandstone, but widely blanketed with Boulder Clay and glacial sand and gravel. Land use mixed farming. Pre-reservoir FARL2015 (for WINFAP 5.3 or later) or FARL (for earlier versions of WINFAP) should be used with these records because the peak flow data after the reservoir started impounding is rejected. Pre- and post-reservoir values for FARL2015 are 0.9915 and 0.8294, respectively. Pre- and post-reservoir values for FARL are 0.998 and 0.873, respectively.
The station
Originally a side contracted flume with pilot tube tapping. Since 1994 a permanent non-standard, broad crested weir. Pre-barrage fish pass downstream of the weir.
How it measures flow
Station bypassed above 13.3 cumecs. Various methods used to rate the flume: temporary sharp-edged weir, formula, current meter and floats. Heavily influenced by Blithfield Reservoir, built in 1952. Naturalised flow series available. Gauged within structure using waded or roped ADCP. Flows have been known to be affected by in-channel and marginal vegetation both up and downstream, though is managed.
Flow regime
Blithfield reservoir built in 1952 - heavily influences the catchment (controls 75% of catchment area).
The flow record
Early data is from before the reservoir impounded and therefore does not form a continuous series with present-day records. Post-reservoir data added to the holdings in v12 but rejected for flood estimation. Full period of record peak flow data reviewed and released in September 2023 (WINFAP Files v12).
How this gauging station is built and how long it has measured (NRFA / UKCEH).
Gauge type
Gauging structure
Operating since
1937
Station datum
63.8 mAOD
Flow record
1937–2024 · 87 yrs · 90% complete
Peak-flow record
since 1937
Hydrometric area
28
Measured by
Environment Agency
Nearby Groundwater
Soil Moisture
Possible storm-overflow correlation
🚽 Storm overflows on this river
Frequently asked questions
Is the River Blithe at Hamstall Ridware flooding today?
The current level is 0.11m, which is within the typical range of 0.10 to 0.80m. Flooding is unlikely at this level.
Is the river level rising or falling at Hamstall Ridware?
Based on the most recent readings, the level is currently steady. The chart above shows the last 7 days of measurements, updated roughly every 15 minutes.
What is a normal level for the River Blithe at Hamstall Ridware?
The typical range at this station is 0.10m to 0.80m, based on Environment Agency historical data. Levels above 0.80m are higher than usually seen and may indicate a flood risk.
How often is this river level data updated?
Readings are taken by the Environment Agency gauge roughly every 15 minutes and FloodRadar refreshes its data continuously, so the level shown is normally less than an hour old.
Embed this gauge on your website
Free live river-level widget — ideal for parish councils, angling clubs and local sites. Updates automatically.
Preview
📮 Flood risk by postcode near this gauge
Postcodes within 5 km with properties in the Environment Agency’s rivers-and-sea flood-risk bands:
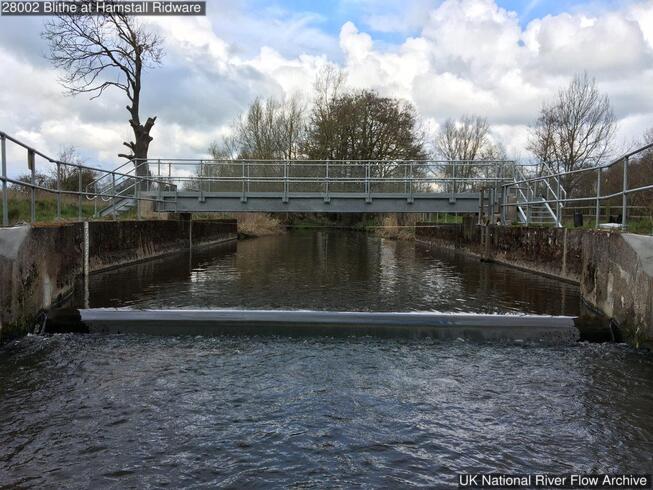 3 Apr 2019 Upstream view to weir and gauging station
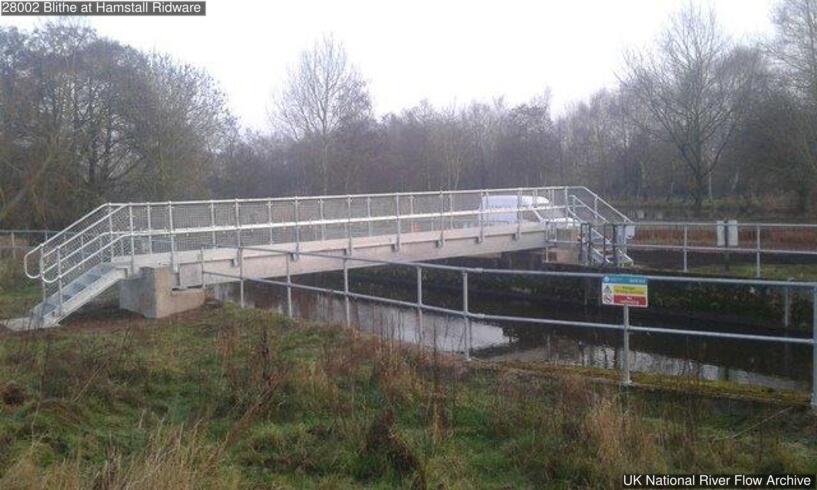 12 Dec 2018 New bridge over channel
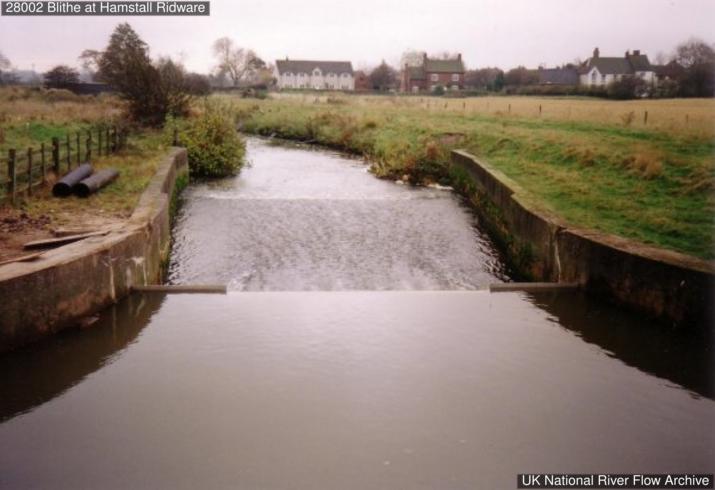 View downstream to thin plate weir
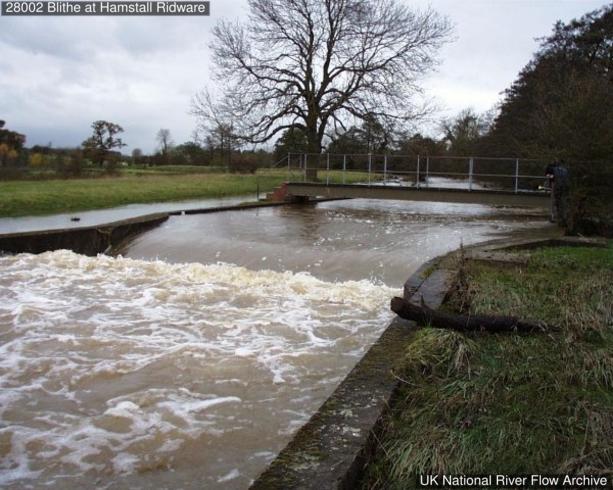 View upstream to weir during peak flow event.
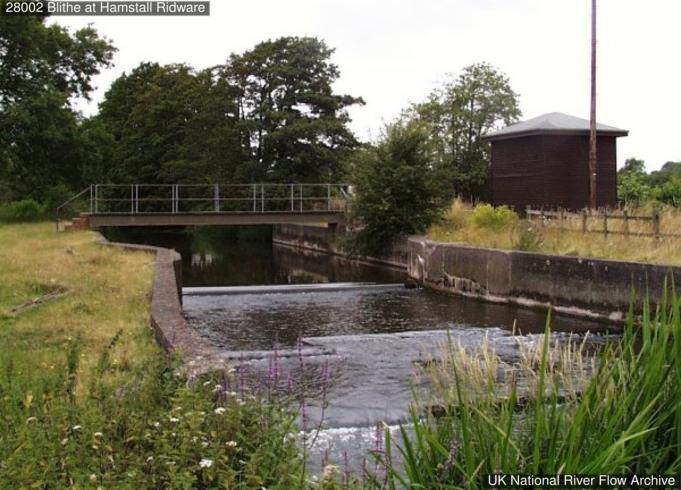 View upstream to weir post thin plate removal.